According to the Urban Institute, owners and renters of manufactured homes are more likely than residents of other housing types to work in the five industries most vulnerable to job loss during the pandemic, with 35% of owners and 43% of renters working in the food and accommodation, retail, construction, entertainment, and other services sectors. While these sectors have been adding jobs, they are not yet at pre-pandemic levels, and an ongoing threat remains from the resurgence of COVID-19 due to the Delta variant. This may have had a negative impact on manufactured housing communities (MHC) and investor interest in the segment. However, to date, MHC fundamentals remain steady, despite volatility in the job market. We believe this bodes well for continued investor interest in the MHC sector.
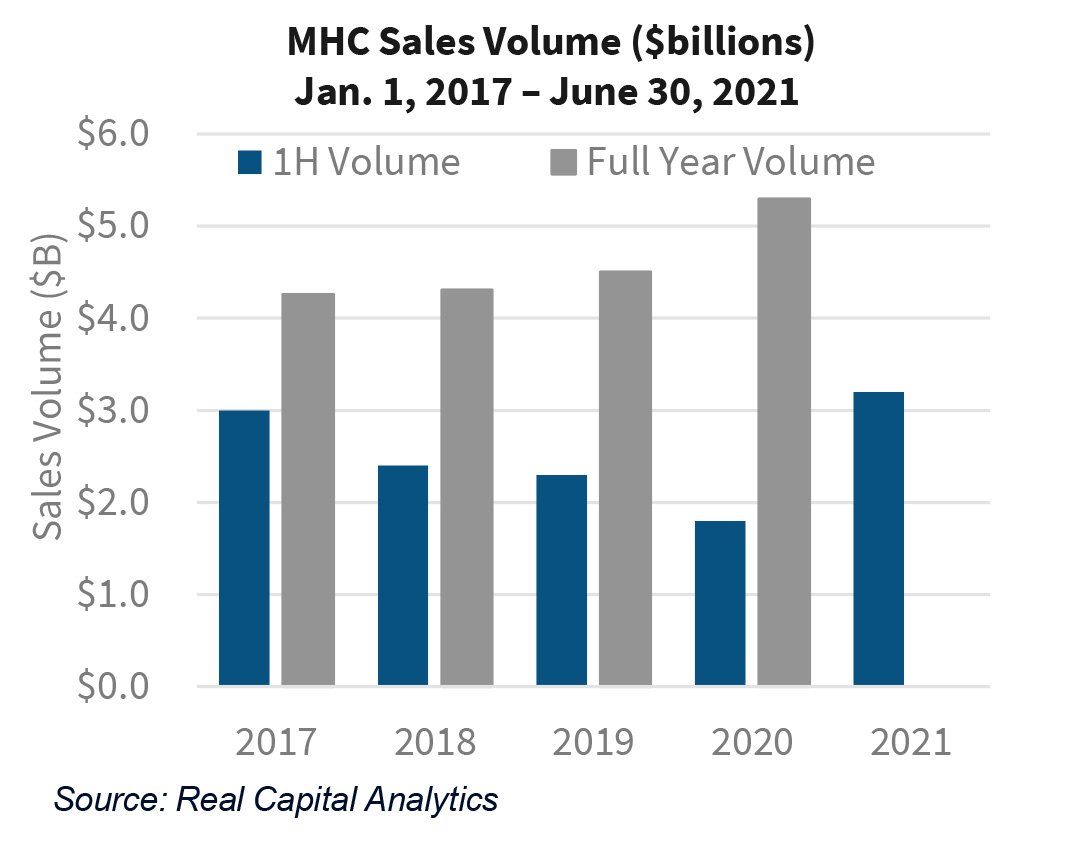
Sales Rise in 2021
During the first half of 2021, sales of MHC totaled $3.2 billion, which is 75% higher than the sales for the first half of 2020. This total was the strongest start to any year since 2017, as shown in the adjacent chart. The volume was evenly split between single asset sales and portfolio sales, which each totaled about $1.6 billion in the first half of the year.
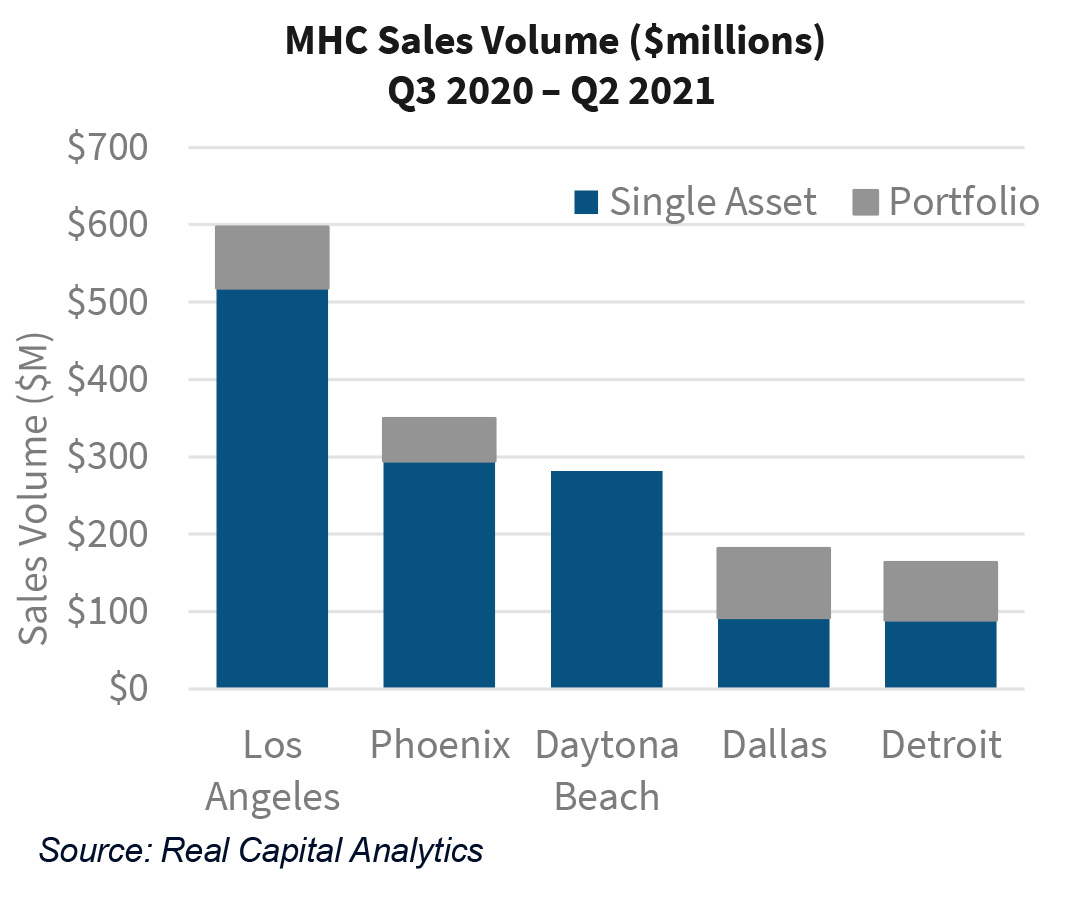
Investor Interest in Many Metros
Investors have appeared most interested in Los Angeles over the past few quarters, spending about $600 million to acquire MHC in the large Los Angeles metro area, as shown in the adjacent chart. Investors also remained interested in another traditional stronghold for MHC, snapping up just under $350 million in properties in the Phoenix metro area. Investor interest in MHC has also grown beyond the Sun Belt. Investors acquired just under $165 billion in MHC in Detroit, making it one of the top metros for investment in MHC over the past year.
Two Types of MHC
There are two types of MHC: All Ages communities and Age 55+ communities. Age 55+ communities, as the name implies, are targeted to seniors. All Ages communities tend to attract families and those who do not want to live in Age 55+ communities. Fundamentals in both segments of MHC appear to have weathered the pandemic across all regions of the country so far.
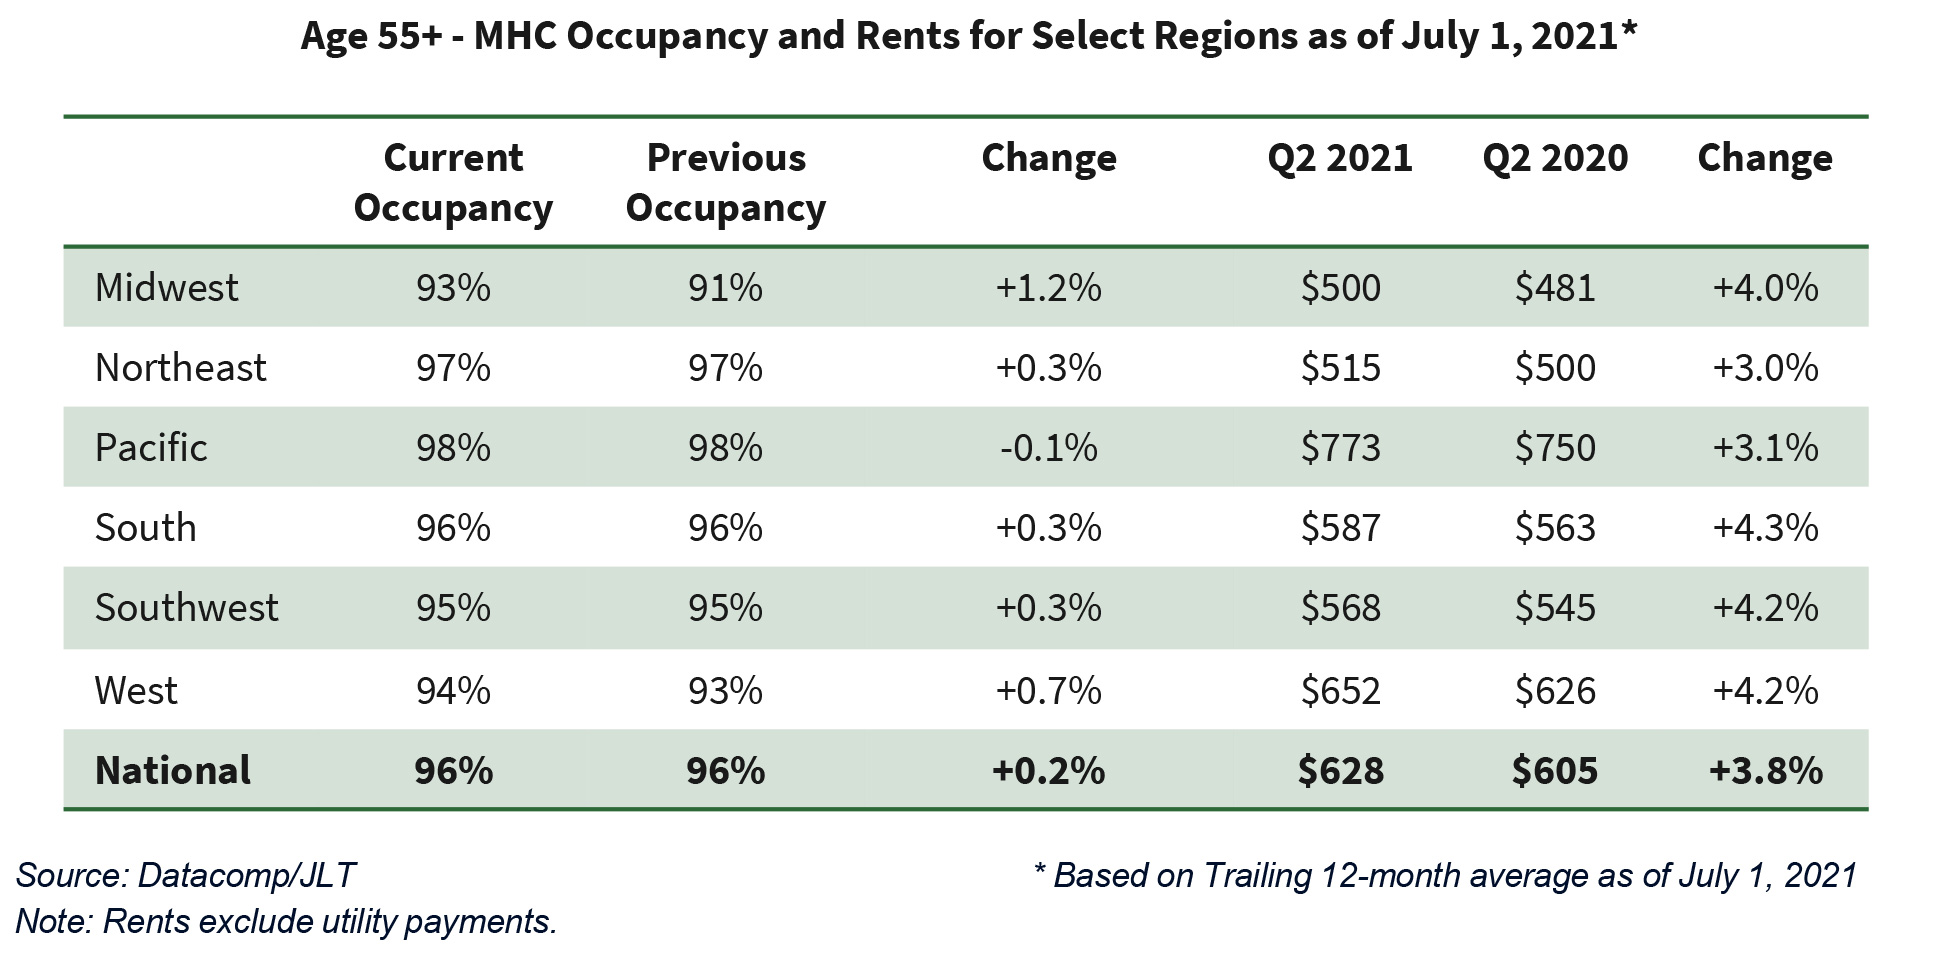
Occupancy Remains Solid in 55+ Communities
Some seniors like to purchase homes in Age 55+ communities for the ease of maintenance and enjoyment of the amenities that are usually offered. This trend has not changed over the past several months, despite the ongoing pandemic. Nationally, the occupancy rate in Age 55+ communities has remained high at 96%, as shown in the table above.
With occupancy rates of 97% or higher, Age 55+ communities in the Northeast and Pacific regions of the country had the highest occupancy rates as of Q2 2021 among the six regions tracked by Datacomp. The other regions saw a slight increase in occupancy. Even the Midwest, which traditionally has had the weakest occupancy, saw occupancy grow over the past year by 1.2% to 93% as of July 1, 2021.
Healthy Rent Growth in Age 55+ Communities
Despite the pandemic, rents grew 3.8% over the past year for pad sites rented in Age 55+ communities as of Q2 2021. This is not surprising as most retirees living in these type of communities tend to have steady monthly sources of income, like retirement and Social Security payments. In fact, four of the six regions tracked by Datacomp recorded rent increases in excess of 4.0% over the past year, with the South recording the highest increase at 4.3%.
All Ages Occupancy Improves as of Q2 2021
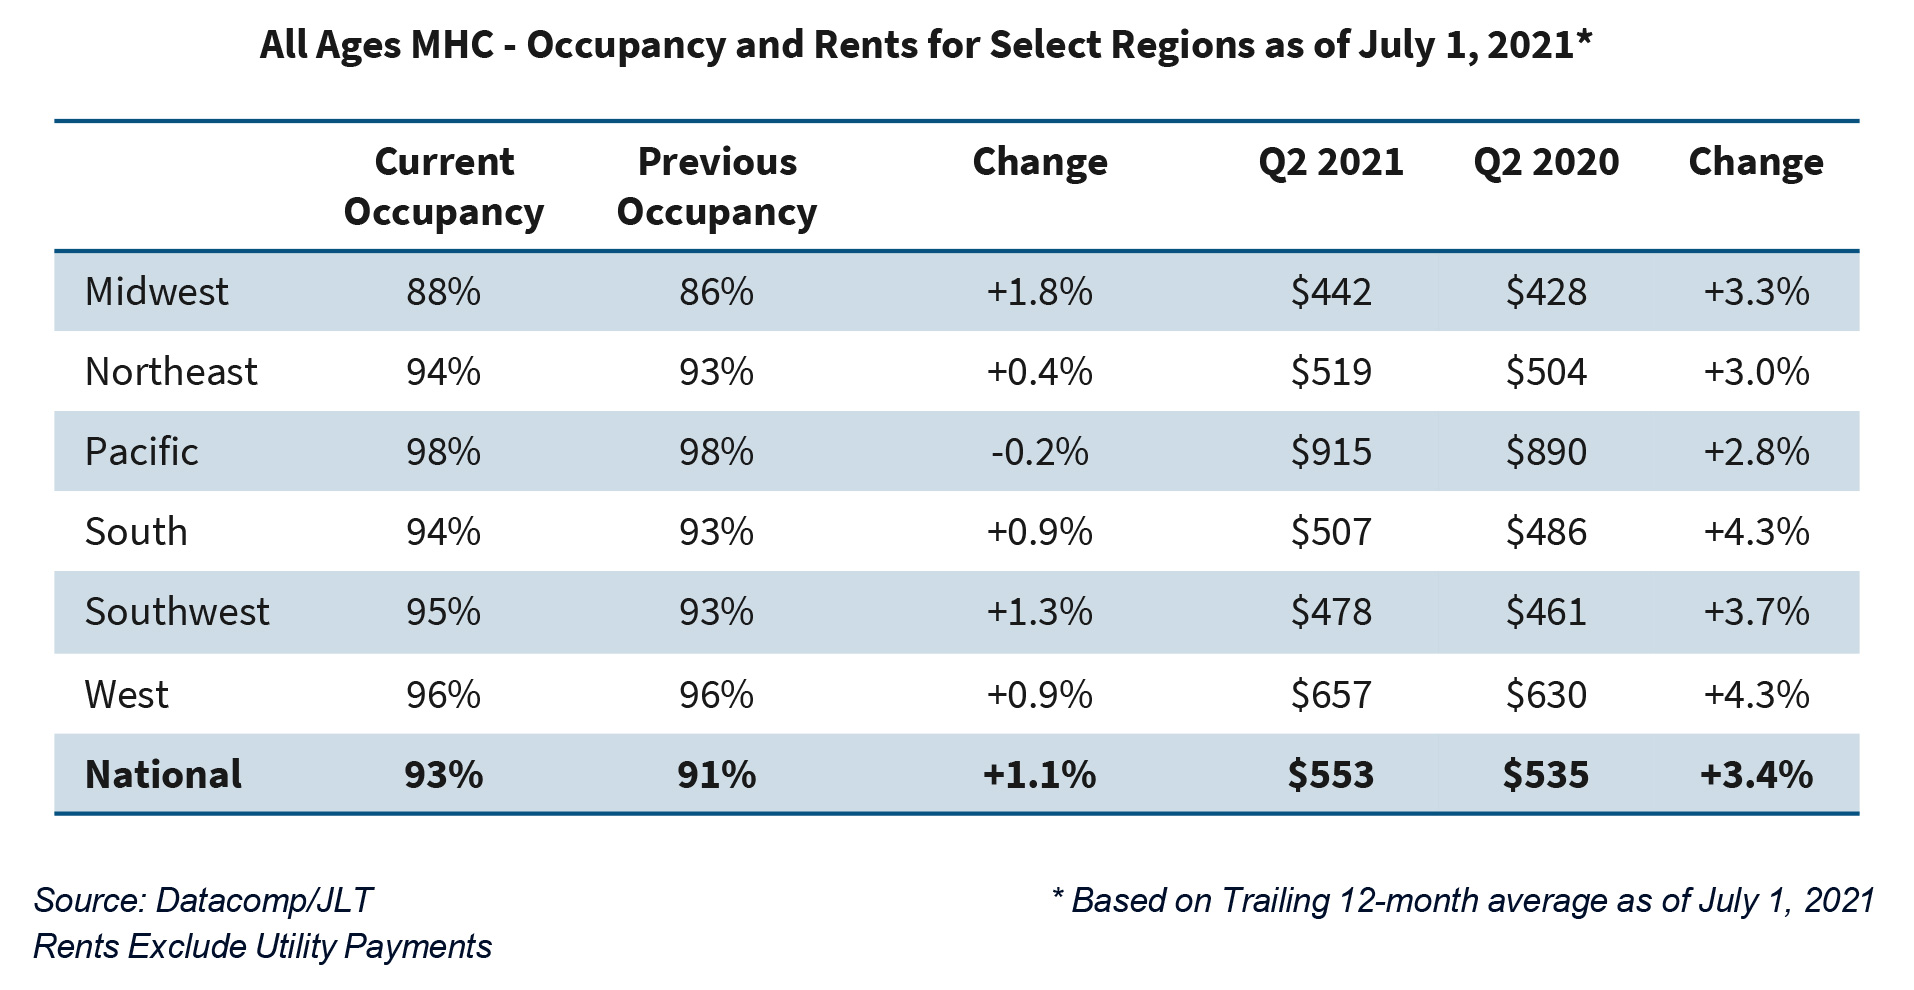
Despite the pandemic, the data for All Ages communities shows that occupancies improved over the past year in all six regions tracked by Datacomp. While this may seem counterintuitive, in surveying MHC owners, Datacomp/JLT found the demand for homes grew during 2020 as some renters looked to purchase new homes for additional space and then chose to locate those homes on a pad site rented in an MHC. This trend has continued into 2021 and has been limited only by a delay in the delivery of new homes due to supply chain disruptions during the pandemic, as well as still elevated (but recently falling) lumber prices.
Nationally, the average occupancy rate for All Ages communities increased by 1.1% during the year, ending Q2 2021 at 93%. Occupancies remain at 94% or higher for five of the six regions tracked by Datacomp as of the end of Q2 2021, as shown in the table below. While the Midwest shows the weakest occupancy, it strengthened by 1.8% over the past year to 88% as of the end of Q2 2021.
Rent Growth Positive in All Ages Communities
Although not as strong as the rent growth in Age 55+ MHC, on average, pad site rents in All Ages communities increased year over year. Despite the pandemic, rents grew by 3.4% over the past year for pad sites rented in All Ages MHC communities to a nationwide average of $553 as of Q2 2021, as shown in the table above. In fact, pad site rents increased by at least 3.0% over the past year (ended Q2 2021) in five of the six regions tracked by Datacomp.
Pad site rents are the least affordable in the Pacific region, which includes California, Washington, and Oregon. However, even in this expensive region, rents grew by 2.8% during the year ending Q2 2021 to $915 on average. Rent growth was strongest in the West and South, growing by 4.3% during the year to $657 and $507, respectively, as of the end of Q2 2021.
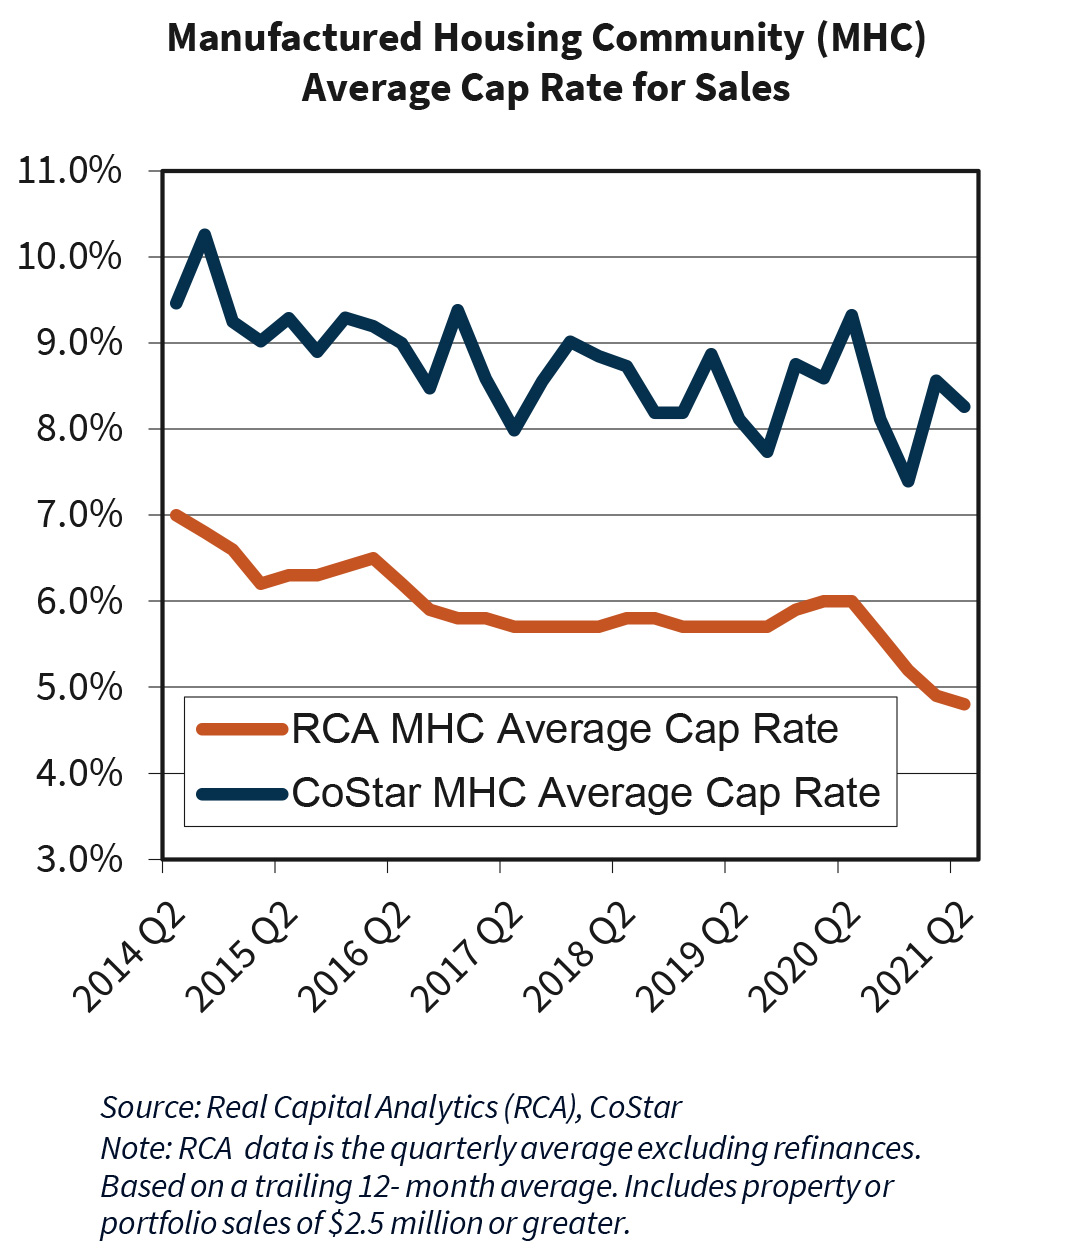
MHC Cap Rates for Sales Remain Stable…
With ongoing interest from a wide variety of investors, and few new communities under construction, capitalization rates for institutional[1]quality MHC have declined significantly in recent years. According to Real Capital Analytics, which tracks larger transactions, the average cap rate for MHC sales fell from an average of 7.0% in Q2 2014 to just under 5.0% as of Q2 2021, as shown in the adjacent chart. While more volatile, CoStar data also shows similar compression, with the average cap rate for MHC sales falling from 9.5% in Q2 2014 to 8.3% as of Q2 2021.
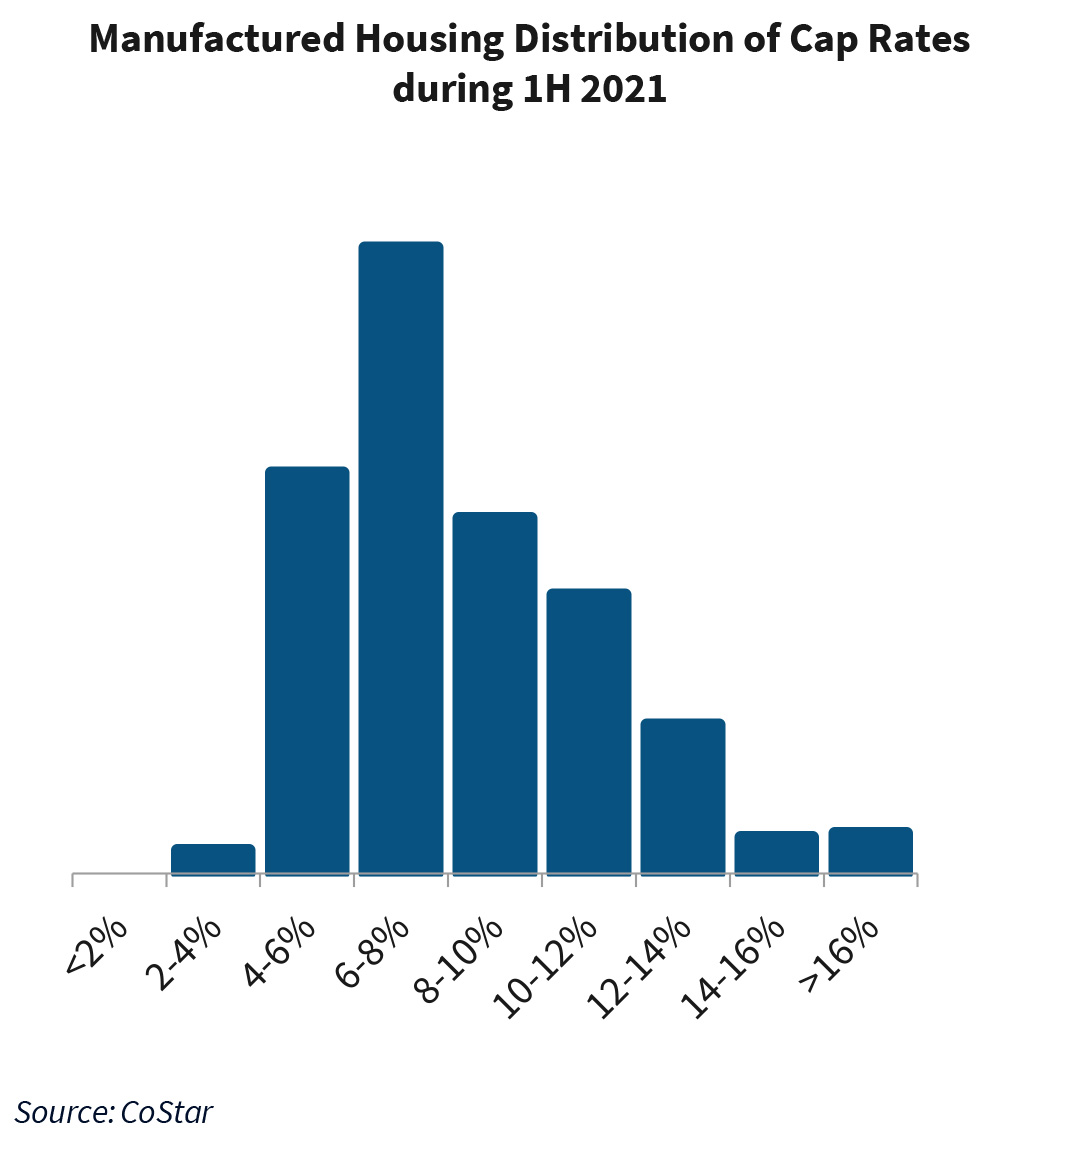
…but There is Wide Dispersion
Both Real Capital Analytics and CoStar show a wide dispersion of cap rates at the time of sale during the first half of 2021. For example, CoStar data shows that about 22% of MHC cap rates at the time of sale for the first half of 2021 were under 6%, as shown in the chart to the right. Another 33% fell into the 6% to 7.9% range, and 19% fell in the 8.0% to 9.9% range.
CoStar data reflects the sales of many smaller MHC properties, which tend to have higher cap rates on average due to potential volatility in cash flow. CoStar data reported that the average number of pad sites per MHC sold in the first half of 2021 was just under 100, compared to just under 200 pad sites for sales tracked by Real Capital Analytics during the same time period. This is reflected in CoStar’s cap rate dispersion, with about 12% of MHC cap rates at the time of sale greater than 12%.
Tanya Zahalak
Senior Multifamily Economist
Fannie Mae Multifamily Economics and Strategic Research
September 14, 2021
Opinions, analyses, estimates, forecasts, and other views of Fannie Mae’s Economic and Strategic Research (ESR) Group included in these materials should not be construed as indicating Fannie Mae’s business prospects or expected results, are based on a number of assumptions, and are subject to change without notice. How this information affects Fannie Mae will depend on many factors. Although the ESR Group bases its opinions, analyses, estimates, forecasts, and other views on information it considers reliable, it does not guarantee that the information provided in these materials is accurate, current, or suitable for any particular purpose. Changes in the assumptions or the information underlying these views could produce materially different results. The analyses, opinions, estimates, forecasts, and other views published by the ESR Group represent the views of that group as of the date indicated and do not necessarily represent the views of Fannie Mae or its management.
Copyright 2021 Fannie Mae