Over the past few years there has been a common refrain among multifamily developers that construction costs are skyrocketing and that only higher-end, class A projects can “pencil out” to be profitable. There have been a number of reasons given for these increasing costs, and they comprise the usual suspects: labor, materials, land, and local regulations. But are those factors the real culprits? What about the differences in hard and soft construction costs? And what were the actual definitions of both?
To gain a better understanding of the magnitude of both hard and soft construction costs, Fannie Mae approached The Gordian Group, Inc., the firm that provides the well-respected RS Means construction data, to conduct a multifamily construction cost survey. The goal of the survey was to provide details and clarity regarding the cost of multifamily construction, broken down into both hard and soft costs categories, as well as the financial and timeline impacts of multifamily permitting and regulation. This data was collected at both the national level and in six of the nation’s major cities: Atlanta, Chicago, Dallas, New York, San Francisco, and Seattle. For the sake of uniformity within the survey, RS Means used a 4- to 7-story building with a brick veneer and steel frame in each city. Furthermore, since land costs are extremely complex and vary from city to city and even neighborhood to neighborhood, RS Means did not include land costs in their total construction cost analysis.
The results of the survey were both surprising and unsurprising, as they confirmed some long-standing multifamily industry chatter. For instance, the survey revealed that building in high-cost cities, such as New York and San Francisco, are significantly more expensive than building in cities with lower costs of living, such as Atlanta. Furthermore, outside of San Francisco, the permitting process did not have much of an impact on the completion date of a project in the cities surveyed. Lastly, due to ongoing labor shortages, the cost of labor has the potential to greatly add to the total costs of a multifamily construction project in a given city.
Hard and Soft Construction Costs Defined
Hard costs, as defined by RS Means, are assigned to the following categories: Substructure, Shell, Interiors, Services, Equipment, Furnishings, Contractor Overhead, and Profit.
Substructure includes foundations, walls, and the more structural elements of construction. Shell includes flooring, window construction, and roof construction. Interiors include partitions, doors, finishes, and stairs. Services includes elevators, plumbing, energy supply, and piping. Equipment consists of architectural equipment, and Furnishings includes furniture, décor, etc. that are part of the finished building.
On a national level, the Shell category equates to approximately 24 percent of total multifamily construction costs in 4- to 7-story multifamily buildings. The Services category is actually the most expensive, accounting for nearly 44 percent of total project costs in 4- to 7-story multifamily buildings.
The soft costs portion of multifamily construction are somewhat simpler to define than the hard costs and are consolidated into just one category. RS Means defined soft costs as architectural and engineering fees, consulting fees, legal and accounting fees, permit fees, any unique review fees, impact fees, environmental fees, feasibility study fees, testing fees, and an assortment of required studies, including but not limited to site surveys, traffic studies, geotechnical studies, and other forms of testing. Nationwide, contractor fees, which are part of hard costs and include contractor’s overhead and profit account for approximately 25 percent of the total multifamily construction costs for 4- to 7-story buildings.
Multifamily Hard Costs Differ Greatly by Location
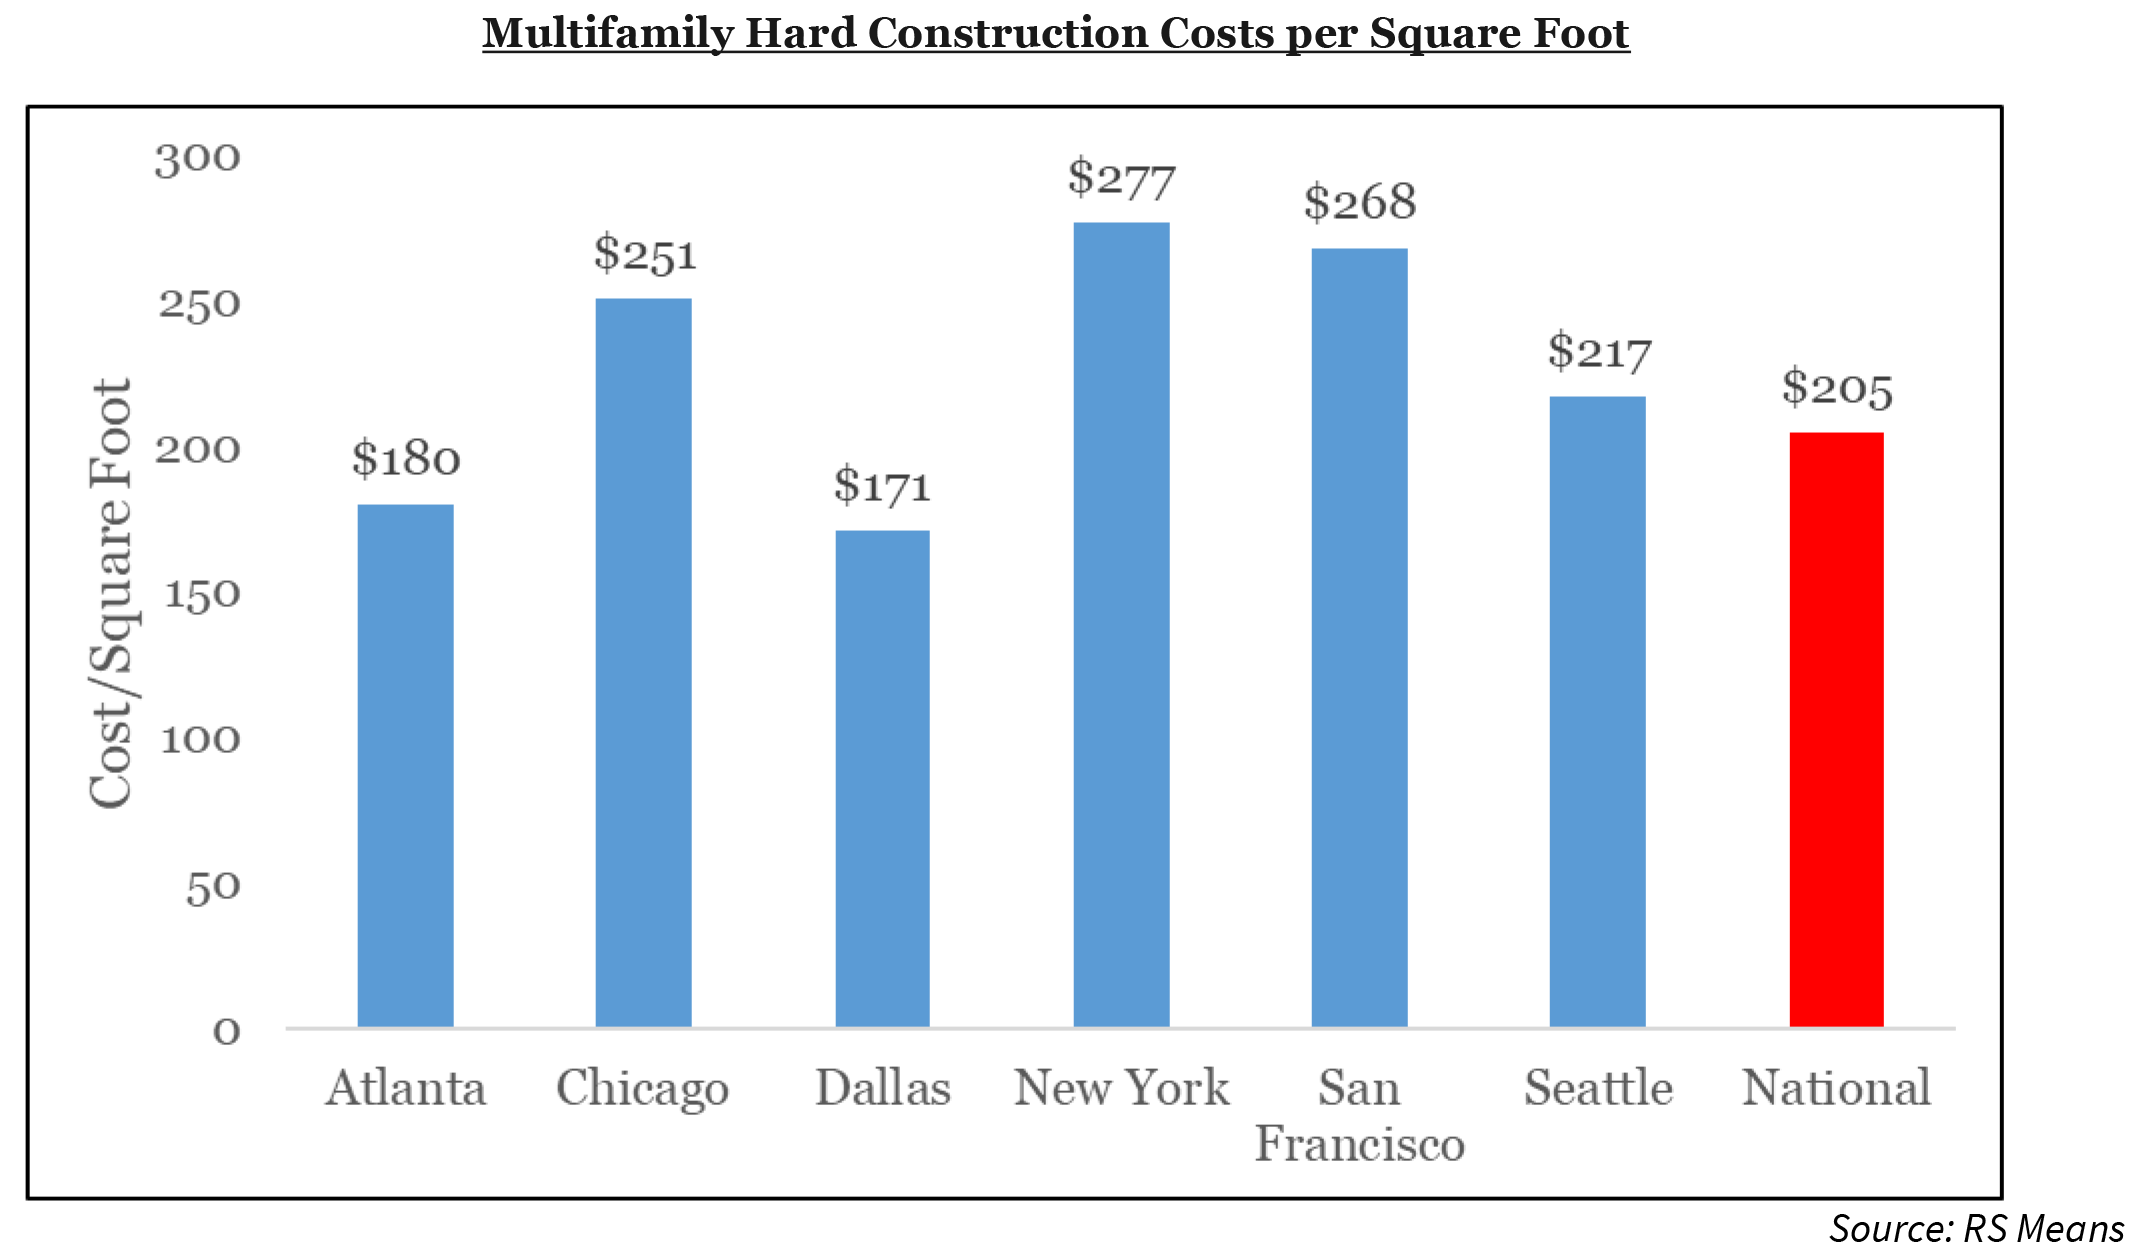
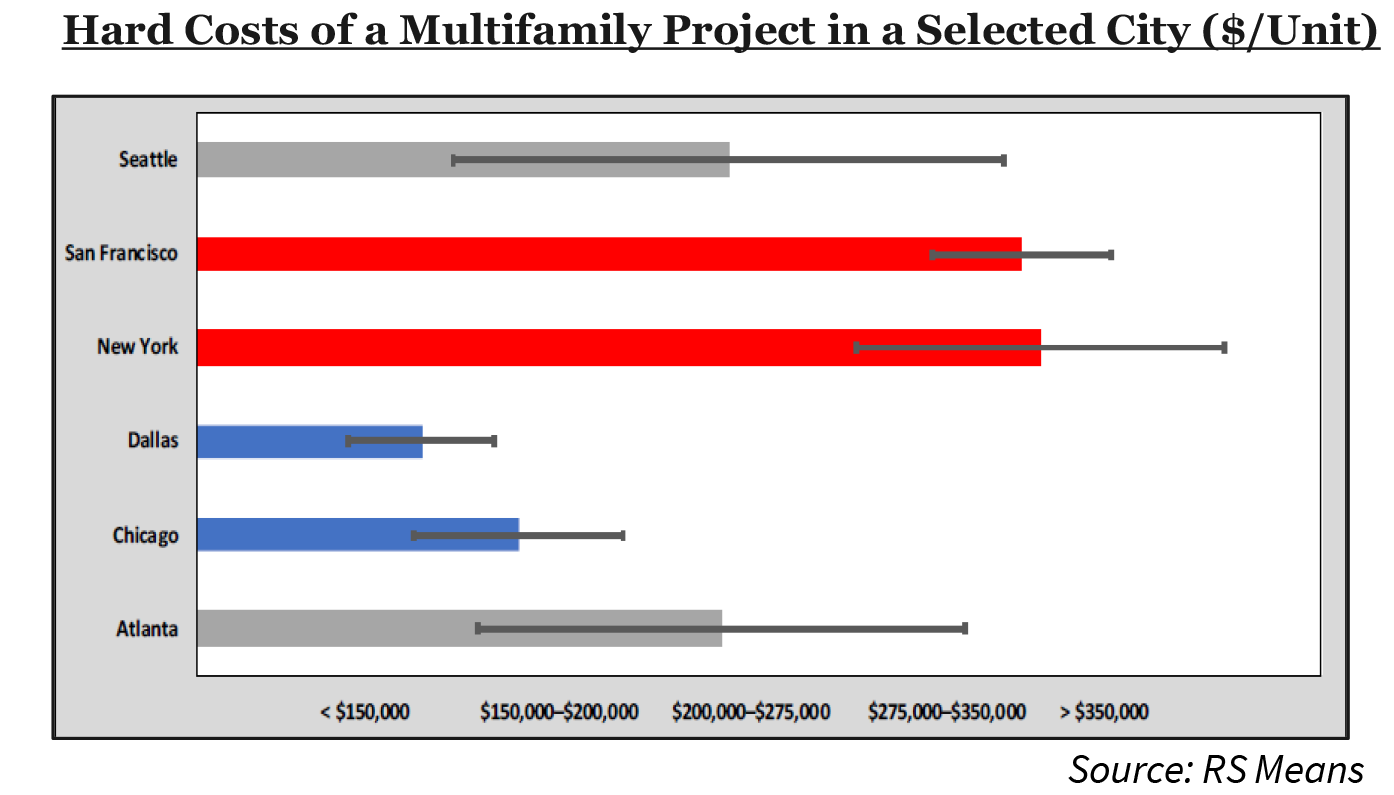
As expected, multifamily hard costs are highest in New York and San Francisco. On the opposite end of the scale, both Dallas and Atlanta were the least expensive among surveyed cities, which also comes as no surprise. Furthermore, both Dallas and Atlanta are below the national average in regard to hard construction costs per square foot.
The biggest driver of higher construction costs came down to the cost of labor. The survey found that labor costs more in New York, San Francisco, and Chicago due to the presence and influence of construction unions. According to RS Means survey respondents, it is less expensive to build a multifamily property in Atlanta, Seattle, and Dallas.
Multifamily Soft Costs Influenced by Timelines
Overall, there was not much difference across the six cities regarding their soft costs for multifamily construction. However, the developers surveyed did reveal some of the factors that impacted the high level of construction costs. The survey revealed that – unsurprisingly – soft costs were the most expensive in both San Francisco and New York due to extensive building requirements, zoning codes, and regulations.
Furthermore, the survey showed that the permitting process took longer than suggested in all six cities. In addition to a prolonged permitting process, developers also incurred what they described as surprise development requirements necessary for the construction project to proceed. One of the constant findings in the soft costs portion of the survey indicated that building codes seem to be constantly changing and evolving, which caused overall construction costs to rise.
Regulatory Findings Reveal Significant Time Delays
The survey found that there were many regulatory barriers that impacted the time required to construct new properties. One key survey question concerned the amount of total time it took to actually start site work on a new project and how much of that timing was influenced by each city’s permitting and regulatory process before developers were able to get crews on the ground. The survey revealed that more often than not, the cities themselves underestimated the amount of time the permitting review and approval process would take. The survey results revealed that 65 percent of the time the permitting process took three to six months longer than what the city had originally projected. Only 30 percent of the survey respondents reported that the regulatory process was in line with what was stated by the local city departments.
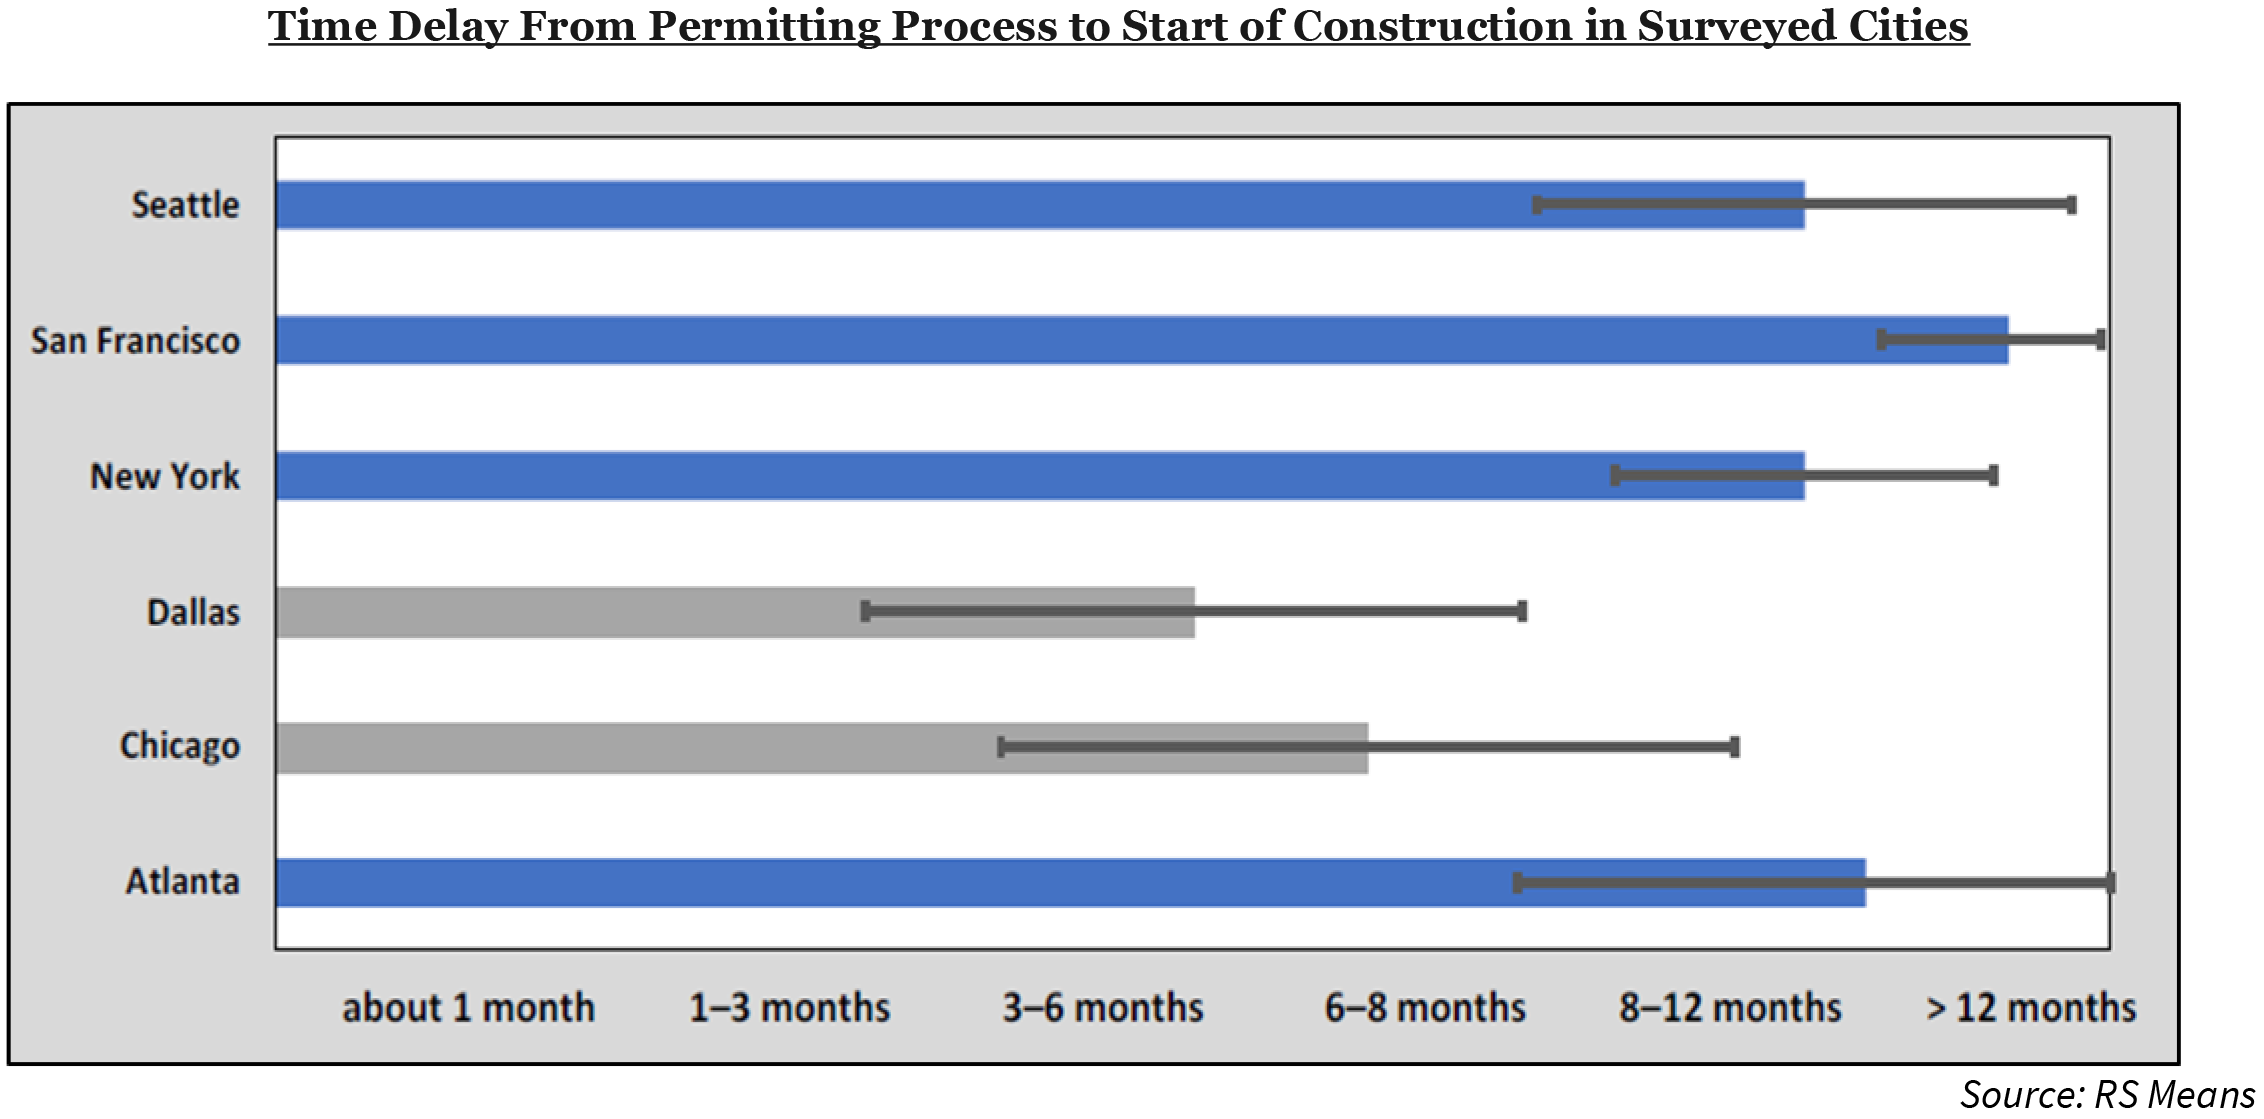
Permitting Timelines Varied Greatly
Of the cities included in the survey, Dallas had the shortest amount of time between the permitting process and the start of construction on a new multifamily project. The time difference in Dallas equated to about three months on average. By comparison, developers indicated that in New York and Seattle it took about eight months to complete the multifamily permitting processes.
Of the cities surveyed, the multifamily permitting process seemed to take the longest amount of time in San Francisco. The time between permitting and actual site work in San Francisco tended to exceed 12 months on average.
Compliance Costs Differ as Well
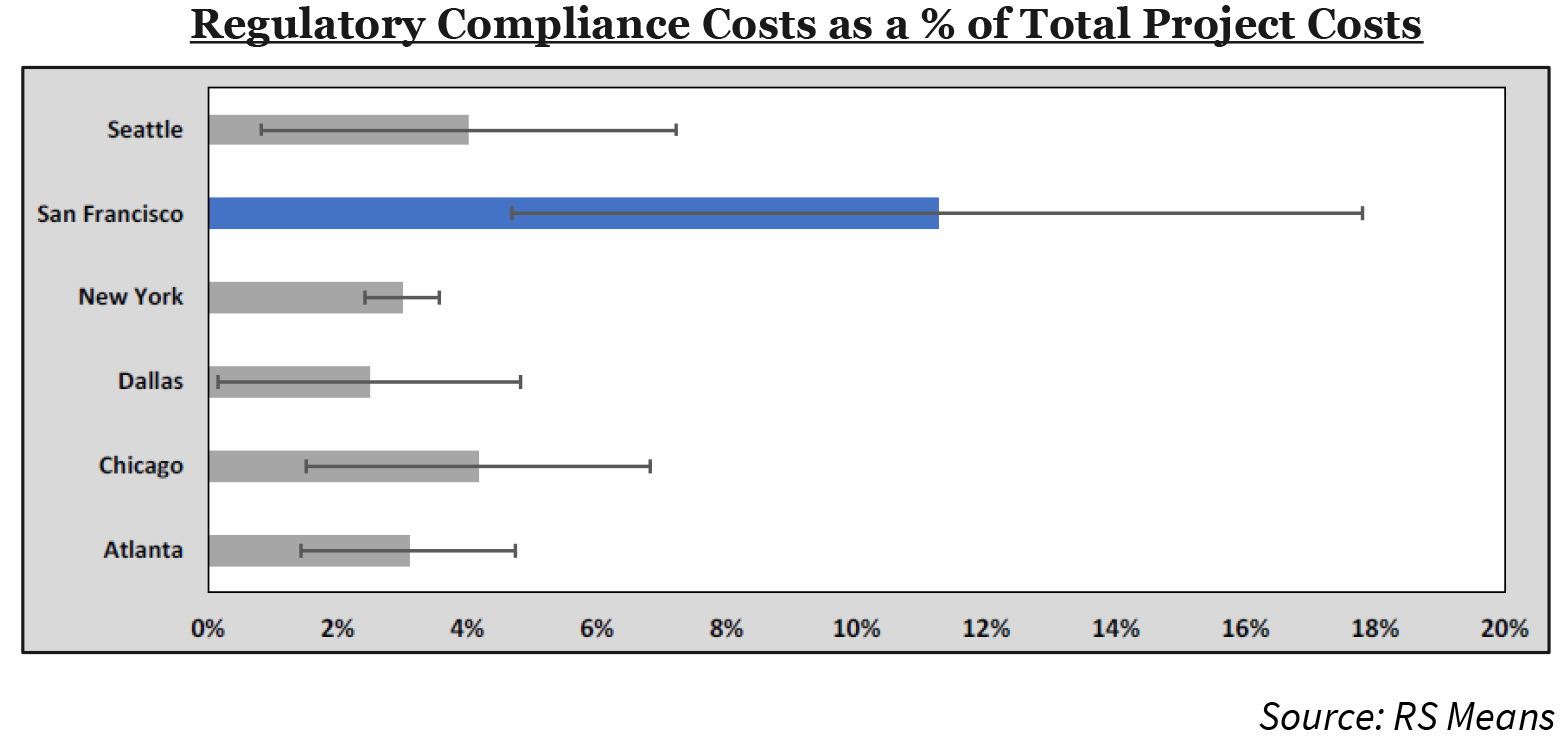
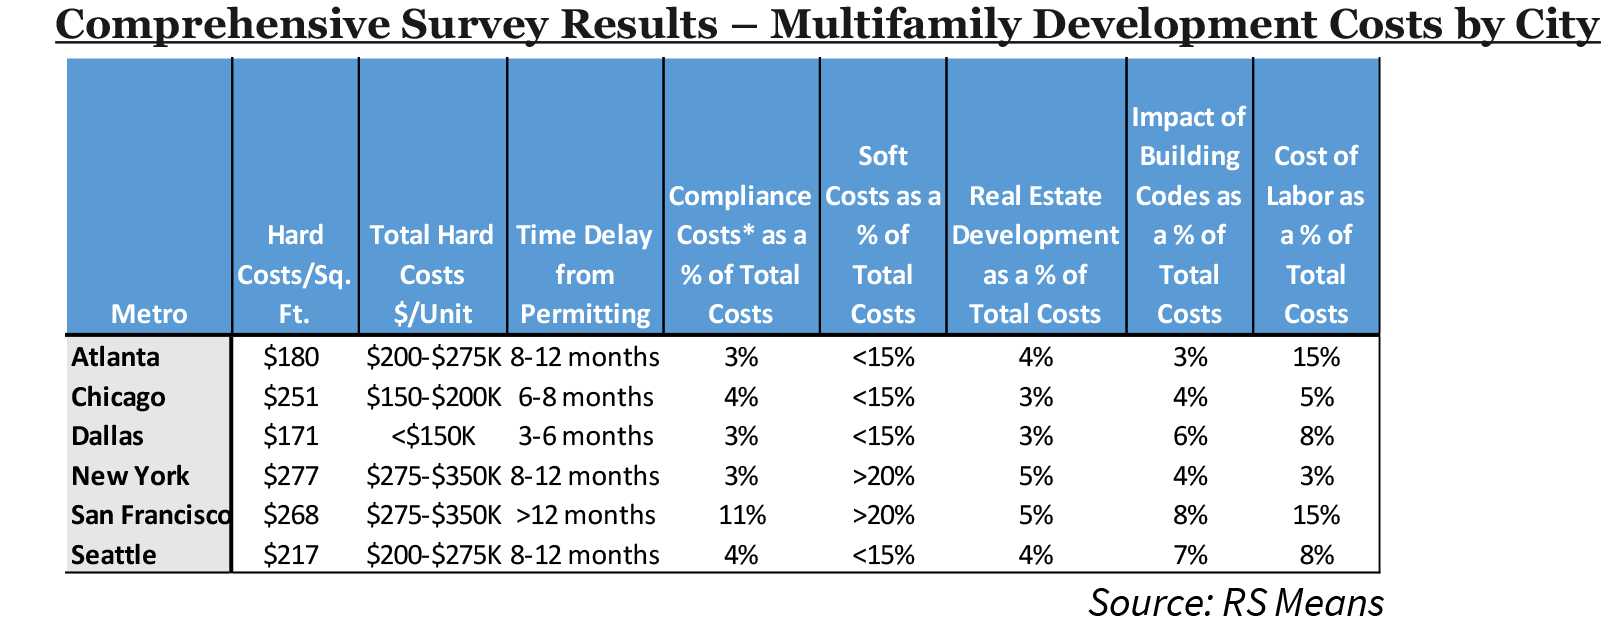
Interestingly, the survey results suggested that permitting, zoning, and other local regulations typically do not add much to the total cost of a project, at least in the majority of the cities surveyed. For multifamily development projects located in Seattle, New York, Dallas, Chicago, and Atlanta, total compliance costs were between 2.0 percent and 4.0 percent of total project costs.
By comparison, San Francisco was the outlier, with respondents stating that compliance costs accounted for more than 10 percent of the total project costs for developments in that city. Even though regulatory compliance costs may not account for a large portion of the total project costs, they are still significant as all regulatory requirements must be met before any actual site work can begin.
Soft Costs a Big Driver of Overall Project Costs
In addition to hard costs and regulatory costs, the survey also asked multifamily developers in the six selected cities about soft costs.
The survey revealed that soft costs are typically within the range of 15 to 25 percent of a total multifamily development project cost. Of the developers surveyed in Atlanta, Chicago, Dallas, and Seattle, the majority estimated that local soft costs equated to less than 15 percent of their total project costs.
Similar to hard costs, soft costs in New York and San Francisco are higher than the other surveyed cities. The majority of developers in both New York and San Francisco responded that soft costs in those two cities equated to more than 20 percent of the total project cost.
Soft Costs Rankings
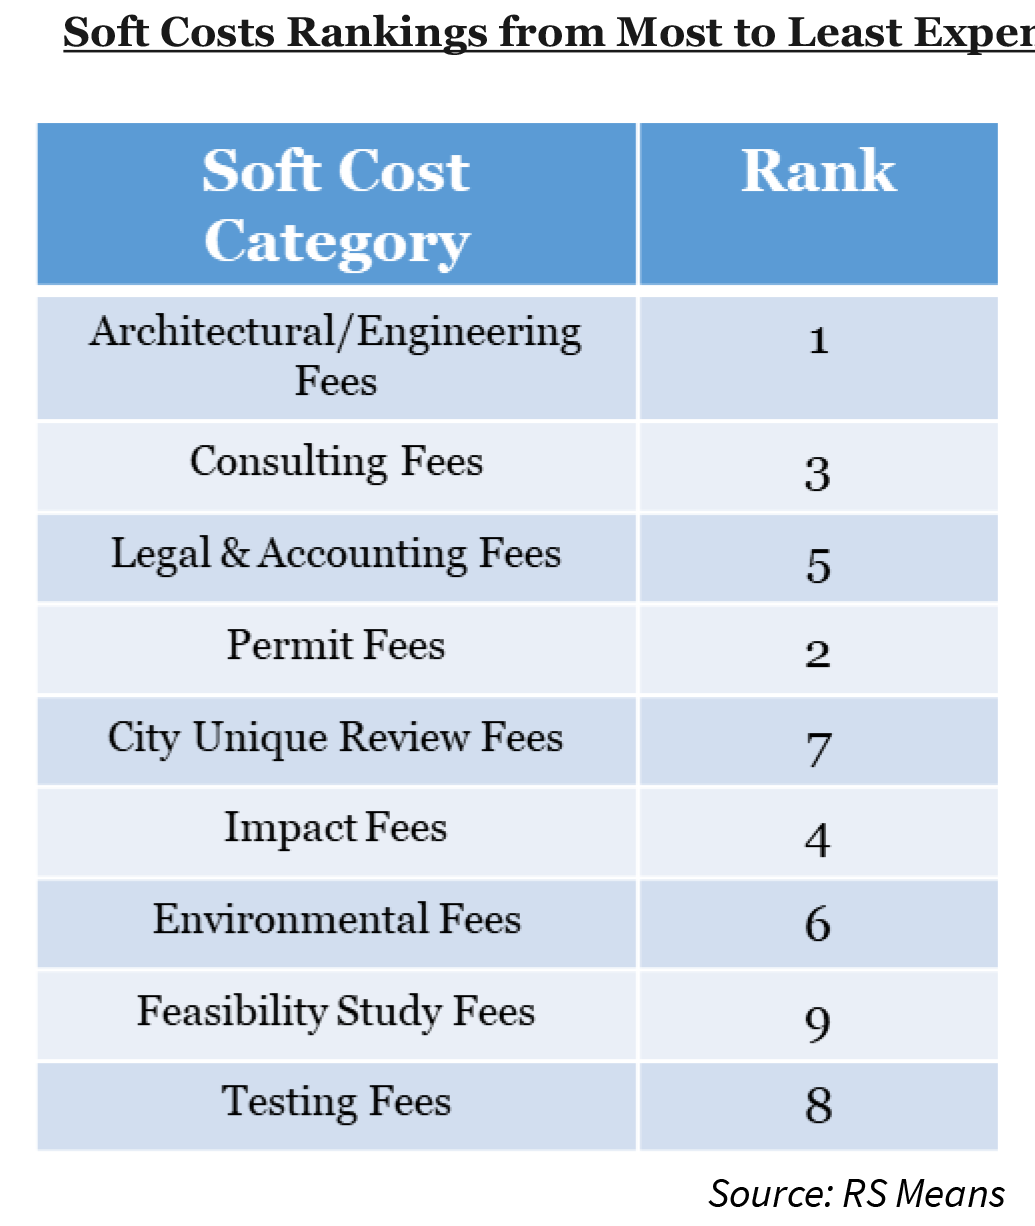
For the soft costs portion of the survey, RS Means identified nine different types of soft costs that could be incurred by multifamily developers in each city and then asked respondents to rank the costs.
Developers in all six cities ranked architectural and engineering fees as the most expensive soft cost for a multifamily development project. Permitting fees came in second. New York was the only city that did not have permitting fees as the second highest soft cost; there, it was legal and accounting fees.
Rounding out the top three was consulting fees, though it was not unanimous among all of the survey respondents. Multifamily developers in Atlanta, Dallas, and Seattle chose impact fees as the third-highest soft cost expenditure, while Chicago, New York, and San Francisco ranked permitting fees third.
Real Estate Development Costs Not Significant
For the purposes of this survey, RS Means did not include land or land financing costs in the categorization of soft costs. Land costs vary greatly by city, submarket, neighborhood, and site location, and are not tied to the actual cost of constructing the building.
Nevertheless, the question was included separately in the survey. Across all six cities, respondents stated that, on average, real estate development fees only accounted for approximately 4.0 percent of total multifamily development project costs.
New York had the largest real estate development percentage of project cost at 5.0 percent, while both Chicago and Dallas had the lowest percentage of project costs at just 3.0 percent. Included in the criteria for defining real estate development fees in the survey were financing costs, interest, tax credits, and any loan fees.
Building Codes Result in a Big Impact on Project Timelines
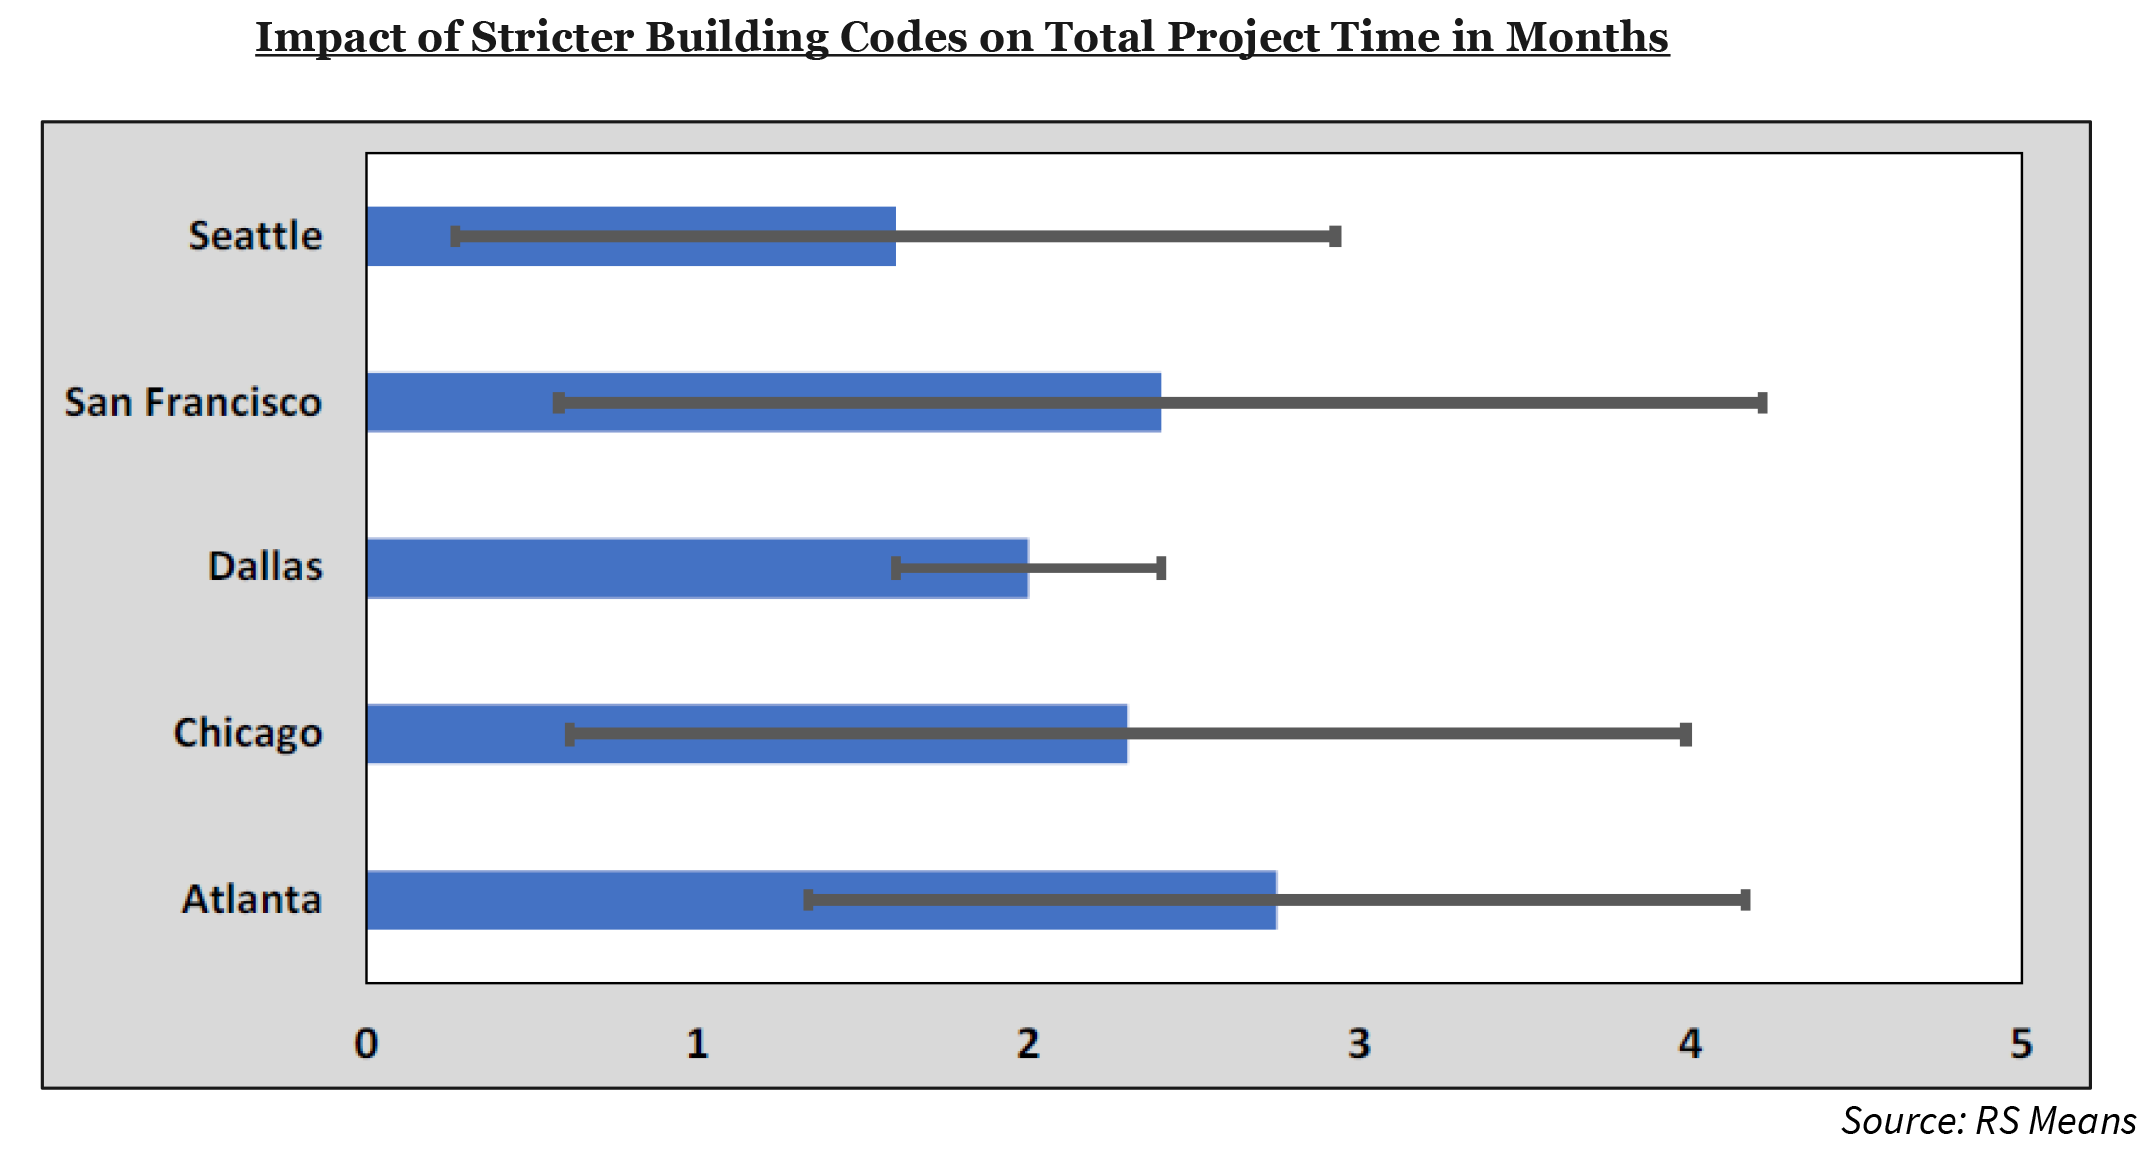
The survey also looked at industry factors that could potentially impact project costs and completion dates. One of the industry factors was the impact of building codes on cost. The developers surveyed in the six cities stated that, on average, stricter building codes increased total multifamily project costs by about 5.8 percent, but it varied by city.
For example, developers in Atlanta reported that stricter building codes only increased their total project costs by about 3.0 percent, which was the lowest impact percentage in the survey. By contrast, San Francisco developers reported that stricter building codes increased their project costs by approximately 8.0 percent.
The average of 5.8 percent of total project costs for stricter building codes increased project completion time by two months on average. Even though Atlanta had the lowest impact from stricter building codes, the city had the highest impact in regard to timelines, at approximately three months. San Francisco trailed right behind Atlanta in regard to the impact of stricter building codes.
Overall the survey revealed that there was not much variance from the impact of stricter building codes on project timelines in the six cities.
Cost of Labor an Ongoing Issue
Labor costs and a shortage of construction workers continue to be a concern for developers. Overall, the survey revealed that labor issues have the potential to worsen as the average age of the construction laborers has increased to 43, up from 36 just 10 years ago.
In addition, the survey found that 80 percent of respondents claimed labor shortages increased the difficulty of completing projects on time. San Francisco and Atlanta were the two surveyed cities impacted the most by the costs of labor. Both of these cities reported that due to the difficulty of finding qualified construction workers, labor could possibly account for an additional 15.0 percent of total project costs. By contrast, developers in New York City were the least impacted by the ongoing labor difficulties compared to the cost of labor.
More Expensive Cities are Similar in Cost Levels
RS Means categorized the six cities surveyed into three different cost groups. San Francisco and New York were deemed the high-cost group; Seattle and Atlanta were identified as the middle-cost group; and lastly Dallas and Chicago were placed into the low-cost group.
The premium to build in San Francisco and New York is significantly higher than the cost to build in the other two groups. Hard costs alone approach close to $350,000 in each of these cities. As a result, the elevated costs of renting in cities in the high-cost group is attributable to elevated development and construction costs.
High Construction Costs + High Land Prices = High Rents
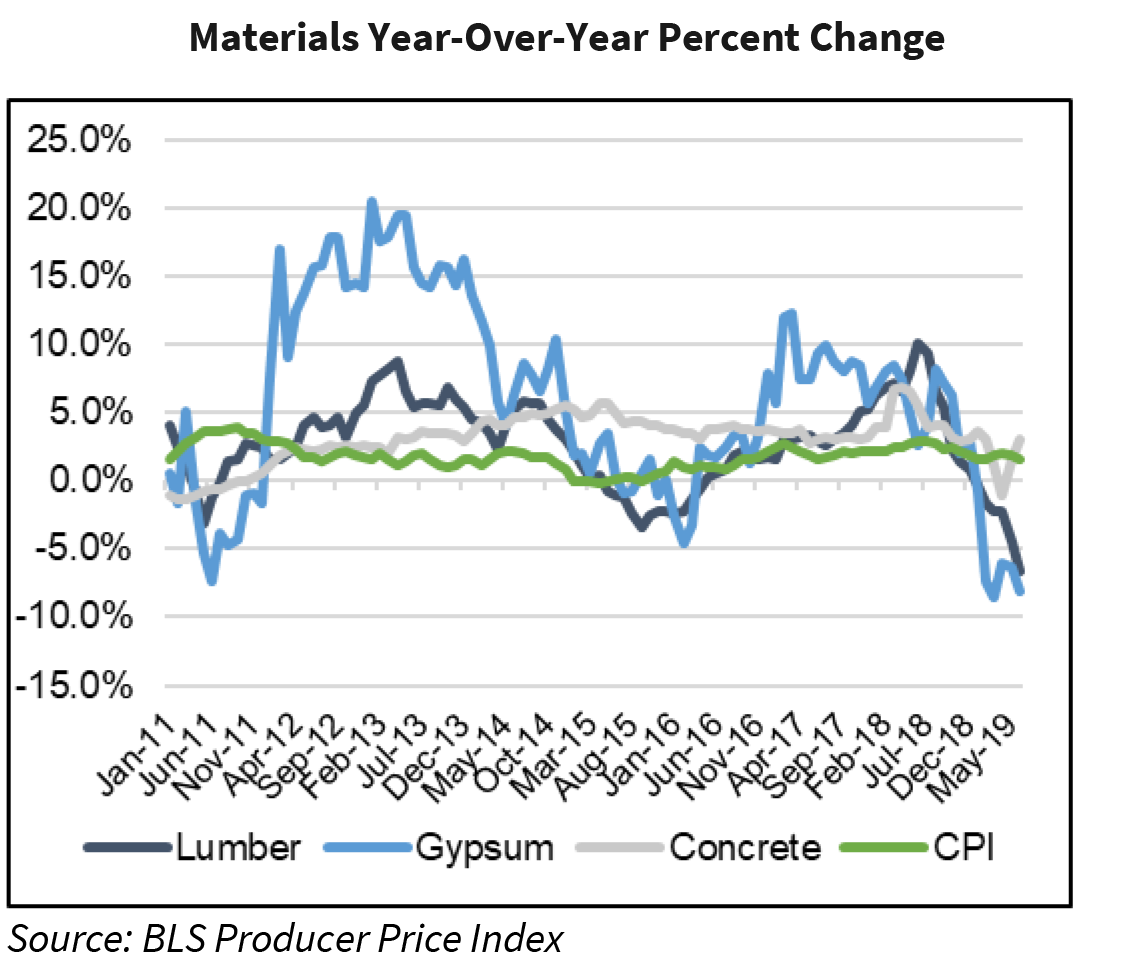
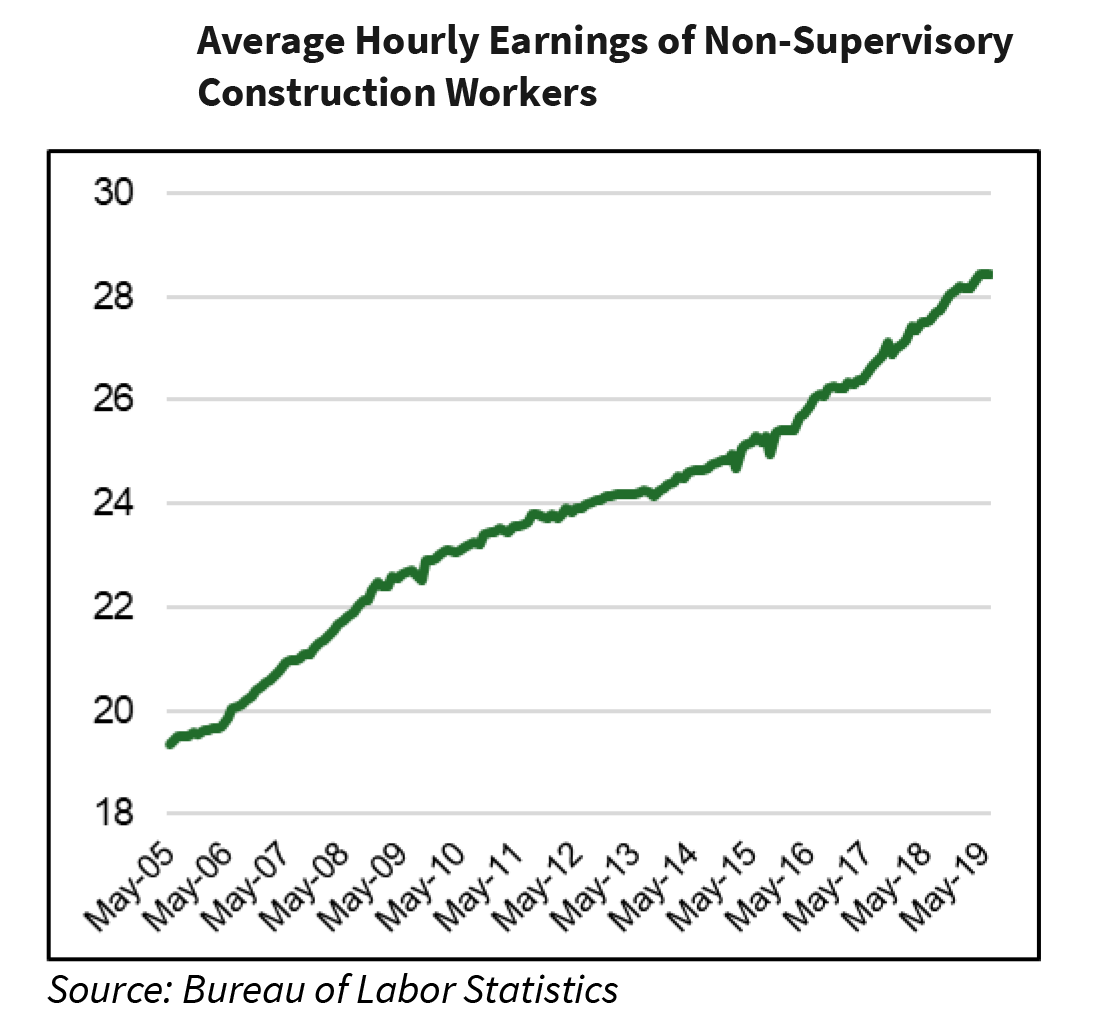
Construction costs continue to rise as a direct result of a few factors. First, the labor shortage has increased the demand for skilled construction workers. Since there is a dearth of skilled workers, the average hourly earnings have increased dramatically since 2005. As of May 2019, hourly wages approached $29/hr. Furthermore, the cost of the materials necessary for construction have fluctuated over the last ten years. These materials include, but are not limited to, lumber, gypsum, and concrete. As of May 2019, the percent change in the prices (year over year) for both lumber and gypsum was negative.
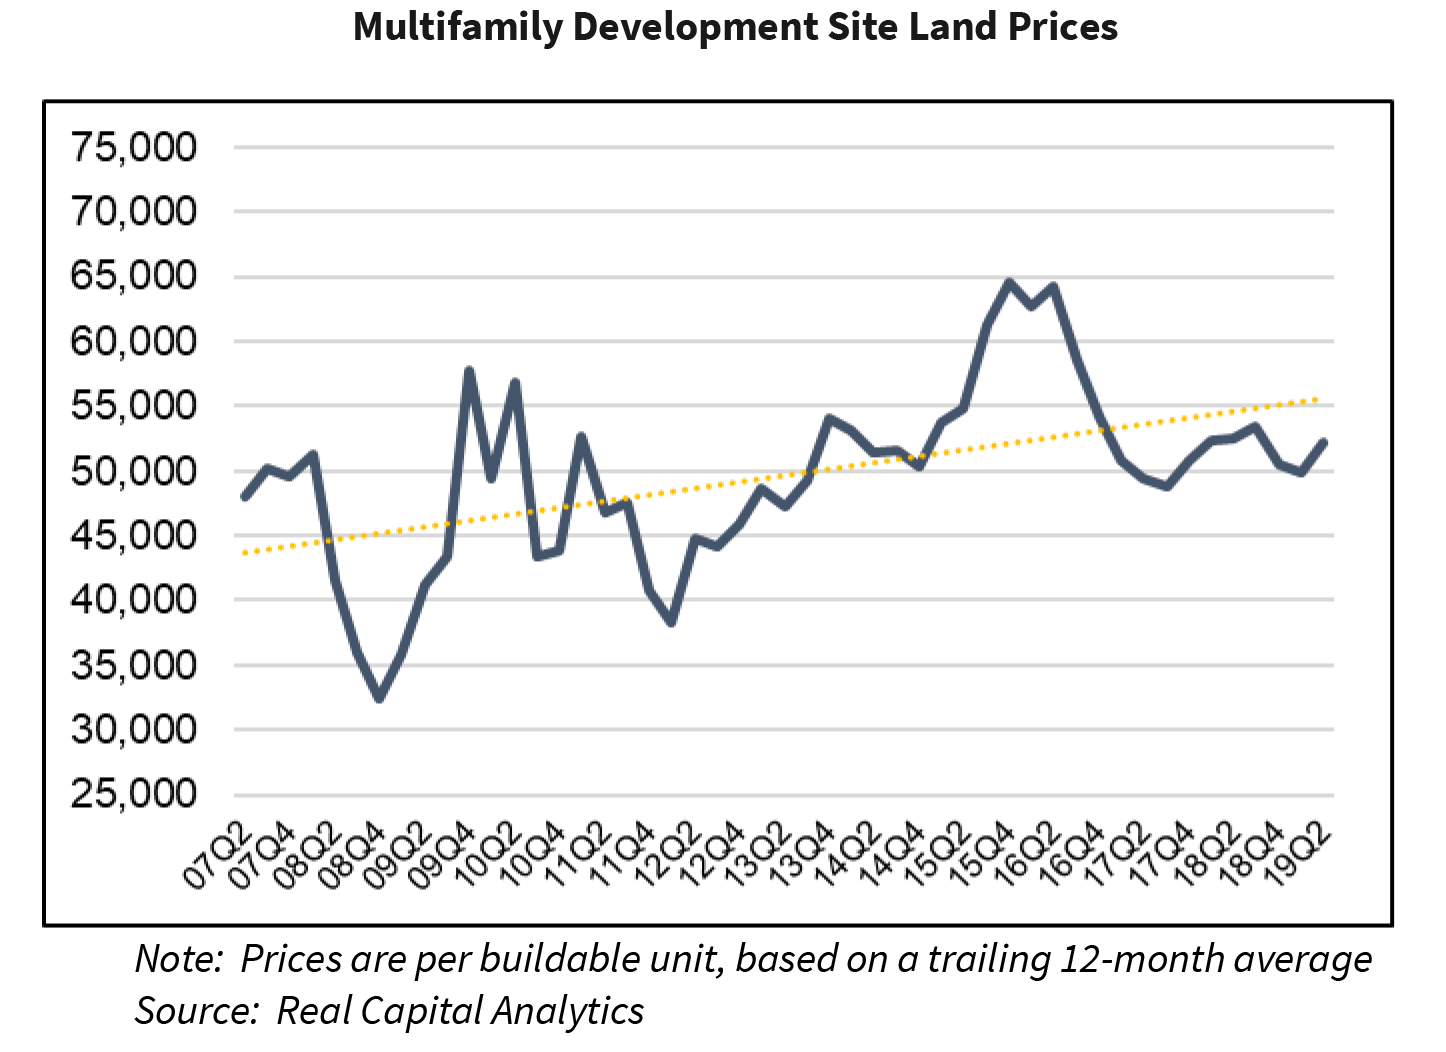
Lastly, land prices continue to rise as well. As of Q2 2019, the cost of land for a multifamily development site was approximately $53,000/unit. During the recession the price fell to as low as $33,000/unit and increased to a peak of
$65,000/unit in Q4 2015. For the last five years prices have consistently stayed in the $50,000-$55,000/unit range.
Atlanta Multifamily Pipeline Elevated
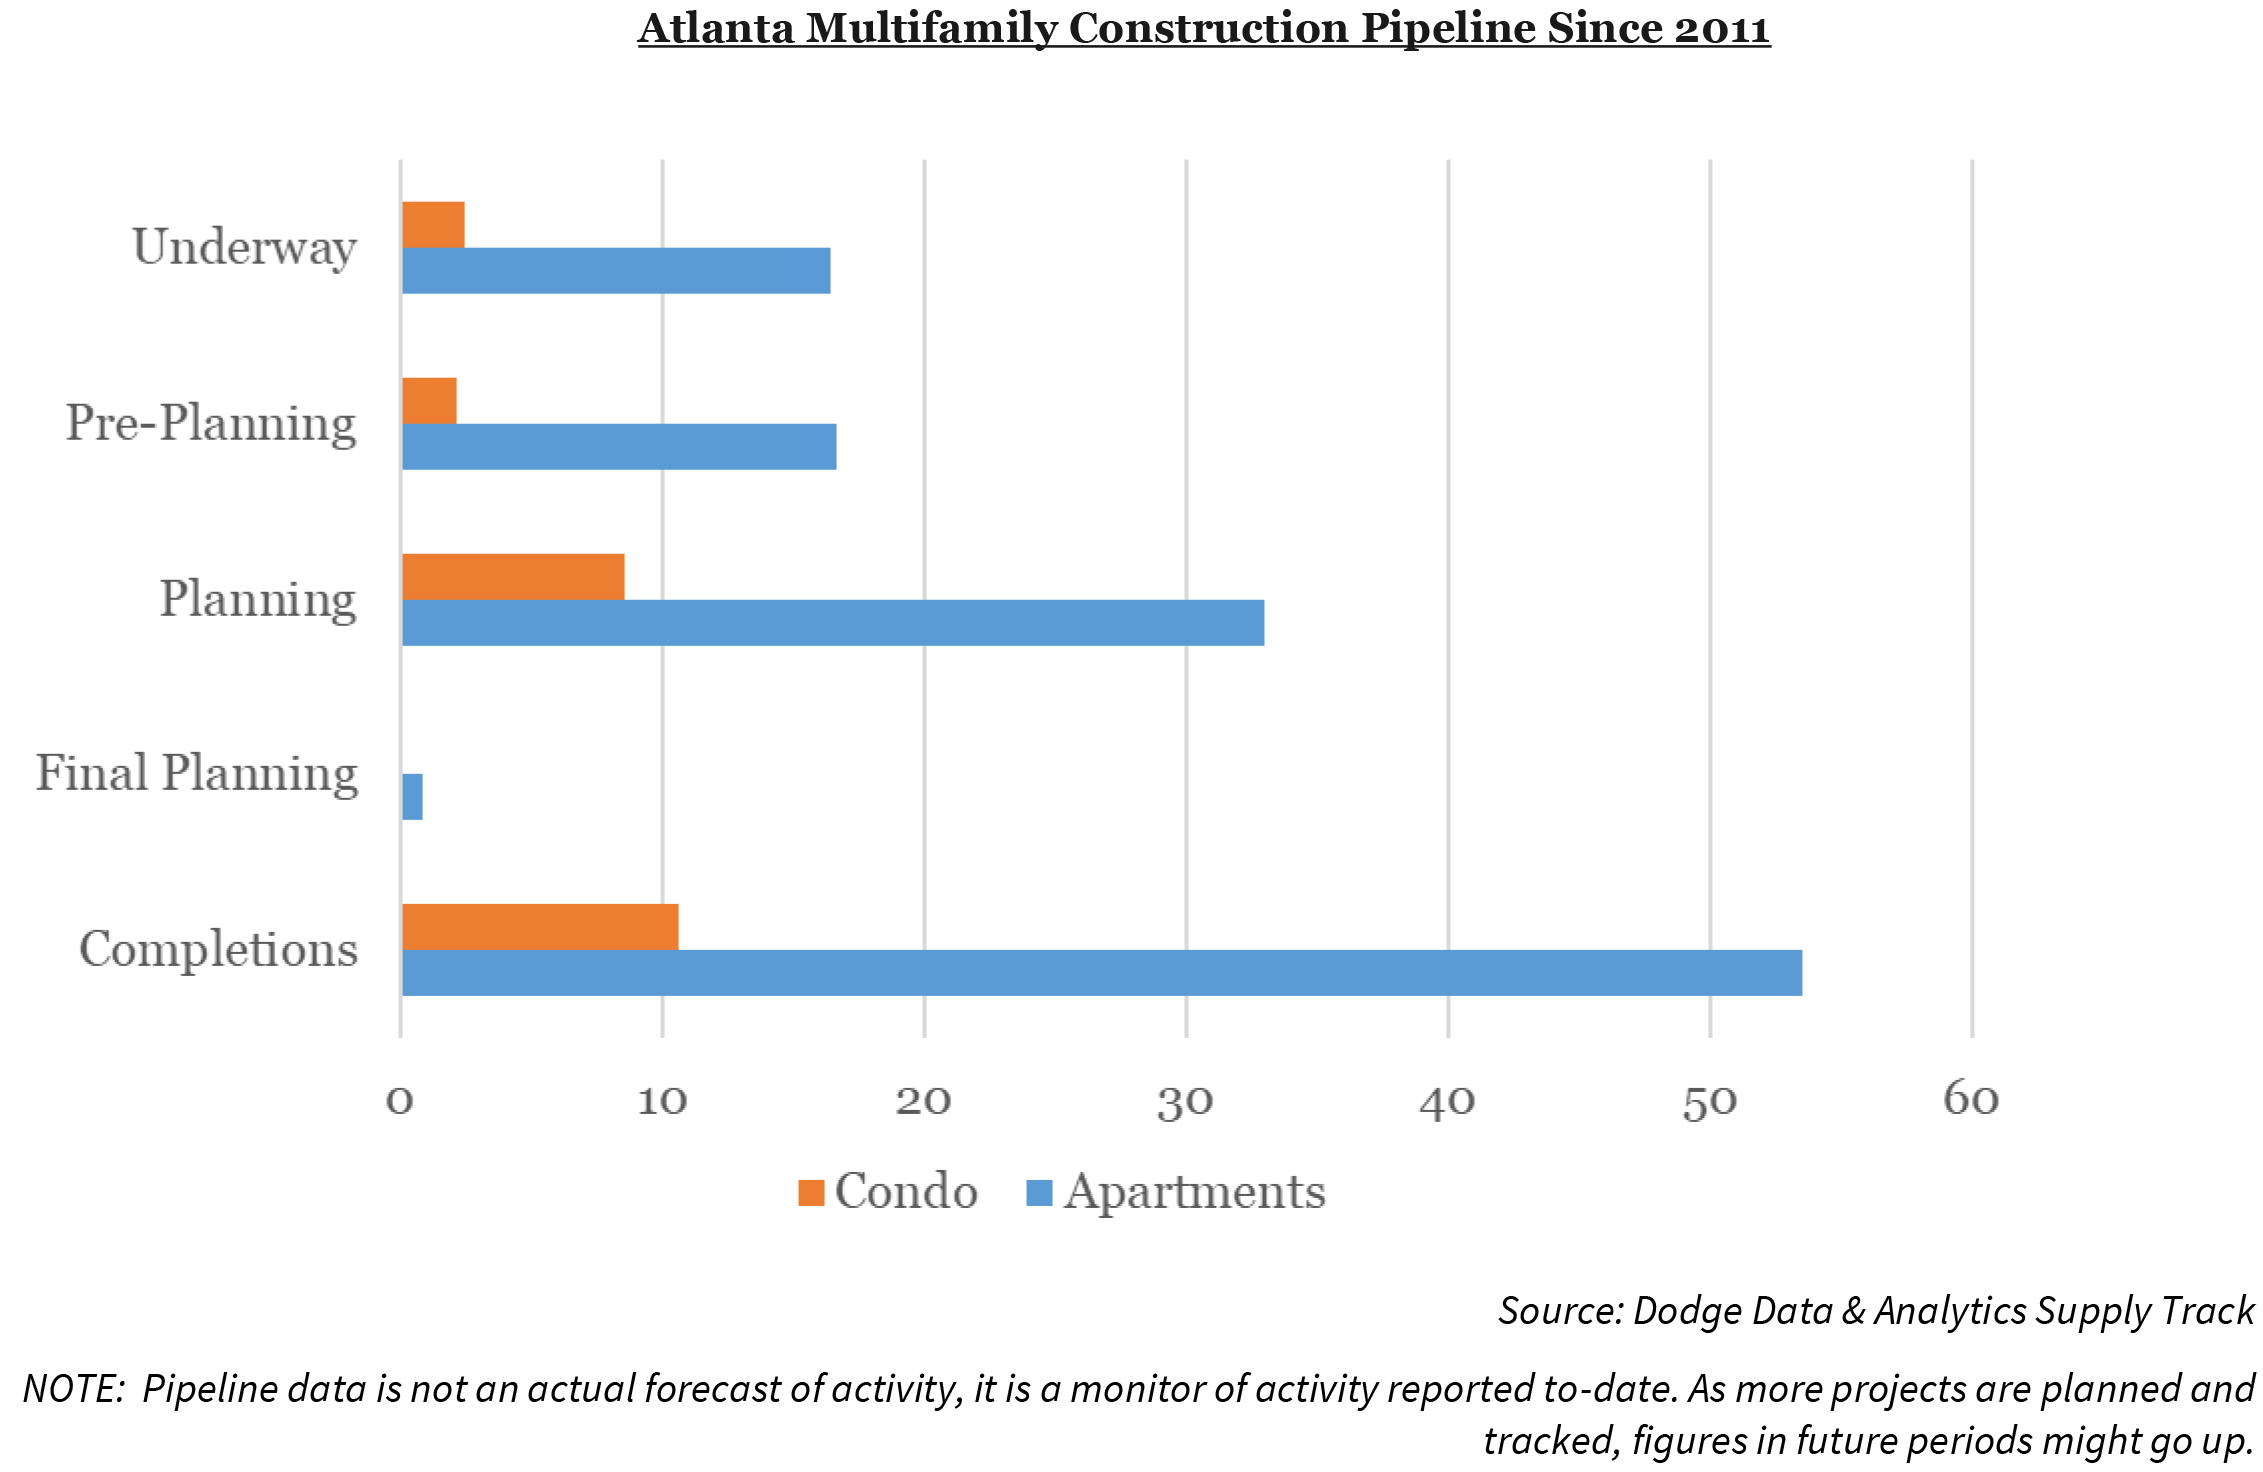
Atlanta is one of the easier and less costly places to build multifamily developments. When analyzing the survey results for Atlanta and comparing them against the activity in the new construction pipeline, it appears that developers also believe that multifamily construction in Atlanta is in their favor. Since 2011, approximately 54,000 apartments have been added to the Atlanta metro area. Of the 54,000 apartments added to the city, the highest amounts of activity took place in 2017 and 2018 when more than 20,000 apartments came online.
Activity in Atlanta has slowed down, albeit slightly. According to the Dodge Data & Analytics Supply Track data, there are approximately 16,000 apartment units underway scheduled for delivery through 2020. Even though projects in the planning stages of the construction pipeline could deliver later than estimated, there is still a substantial amount of activity in the pipeline for Atlanta, at more than 51,000 units.
Chicago Multifamily Pipeline Staying on Pace
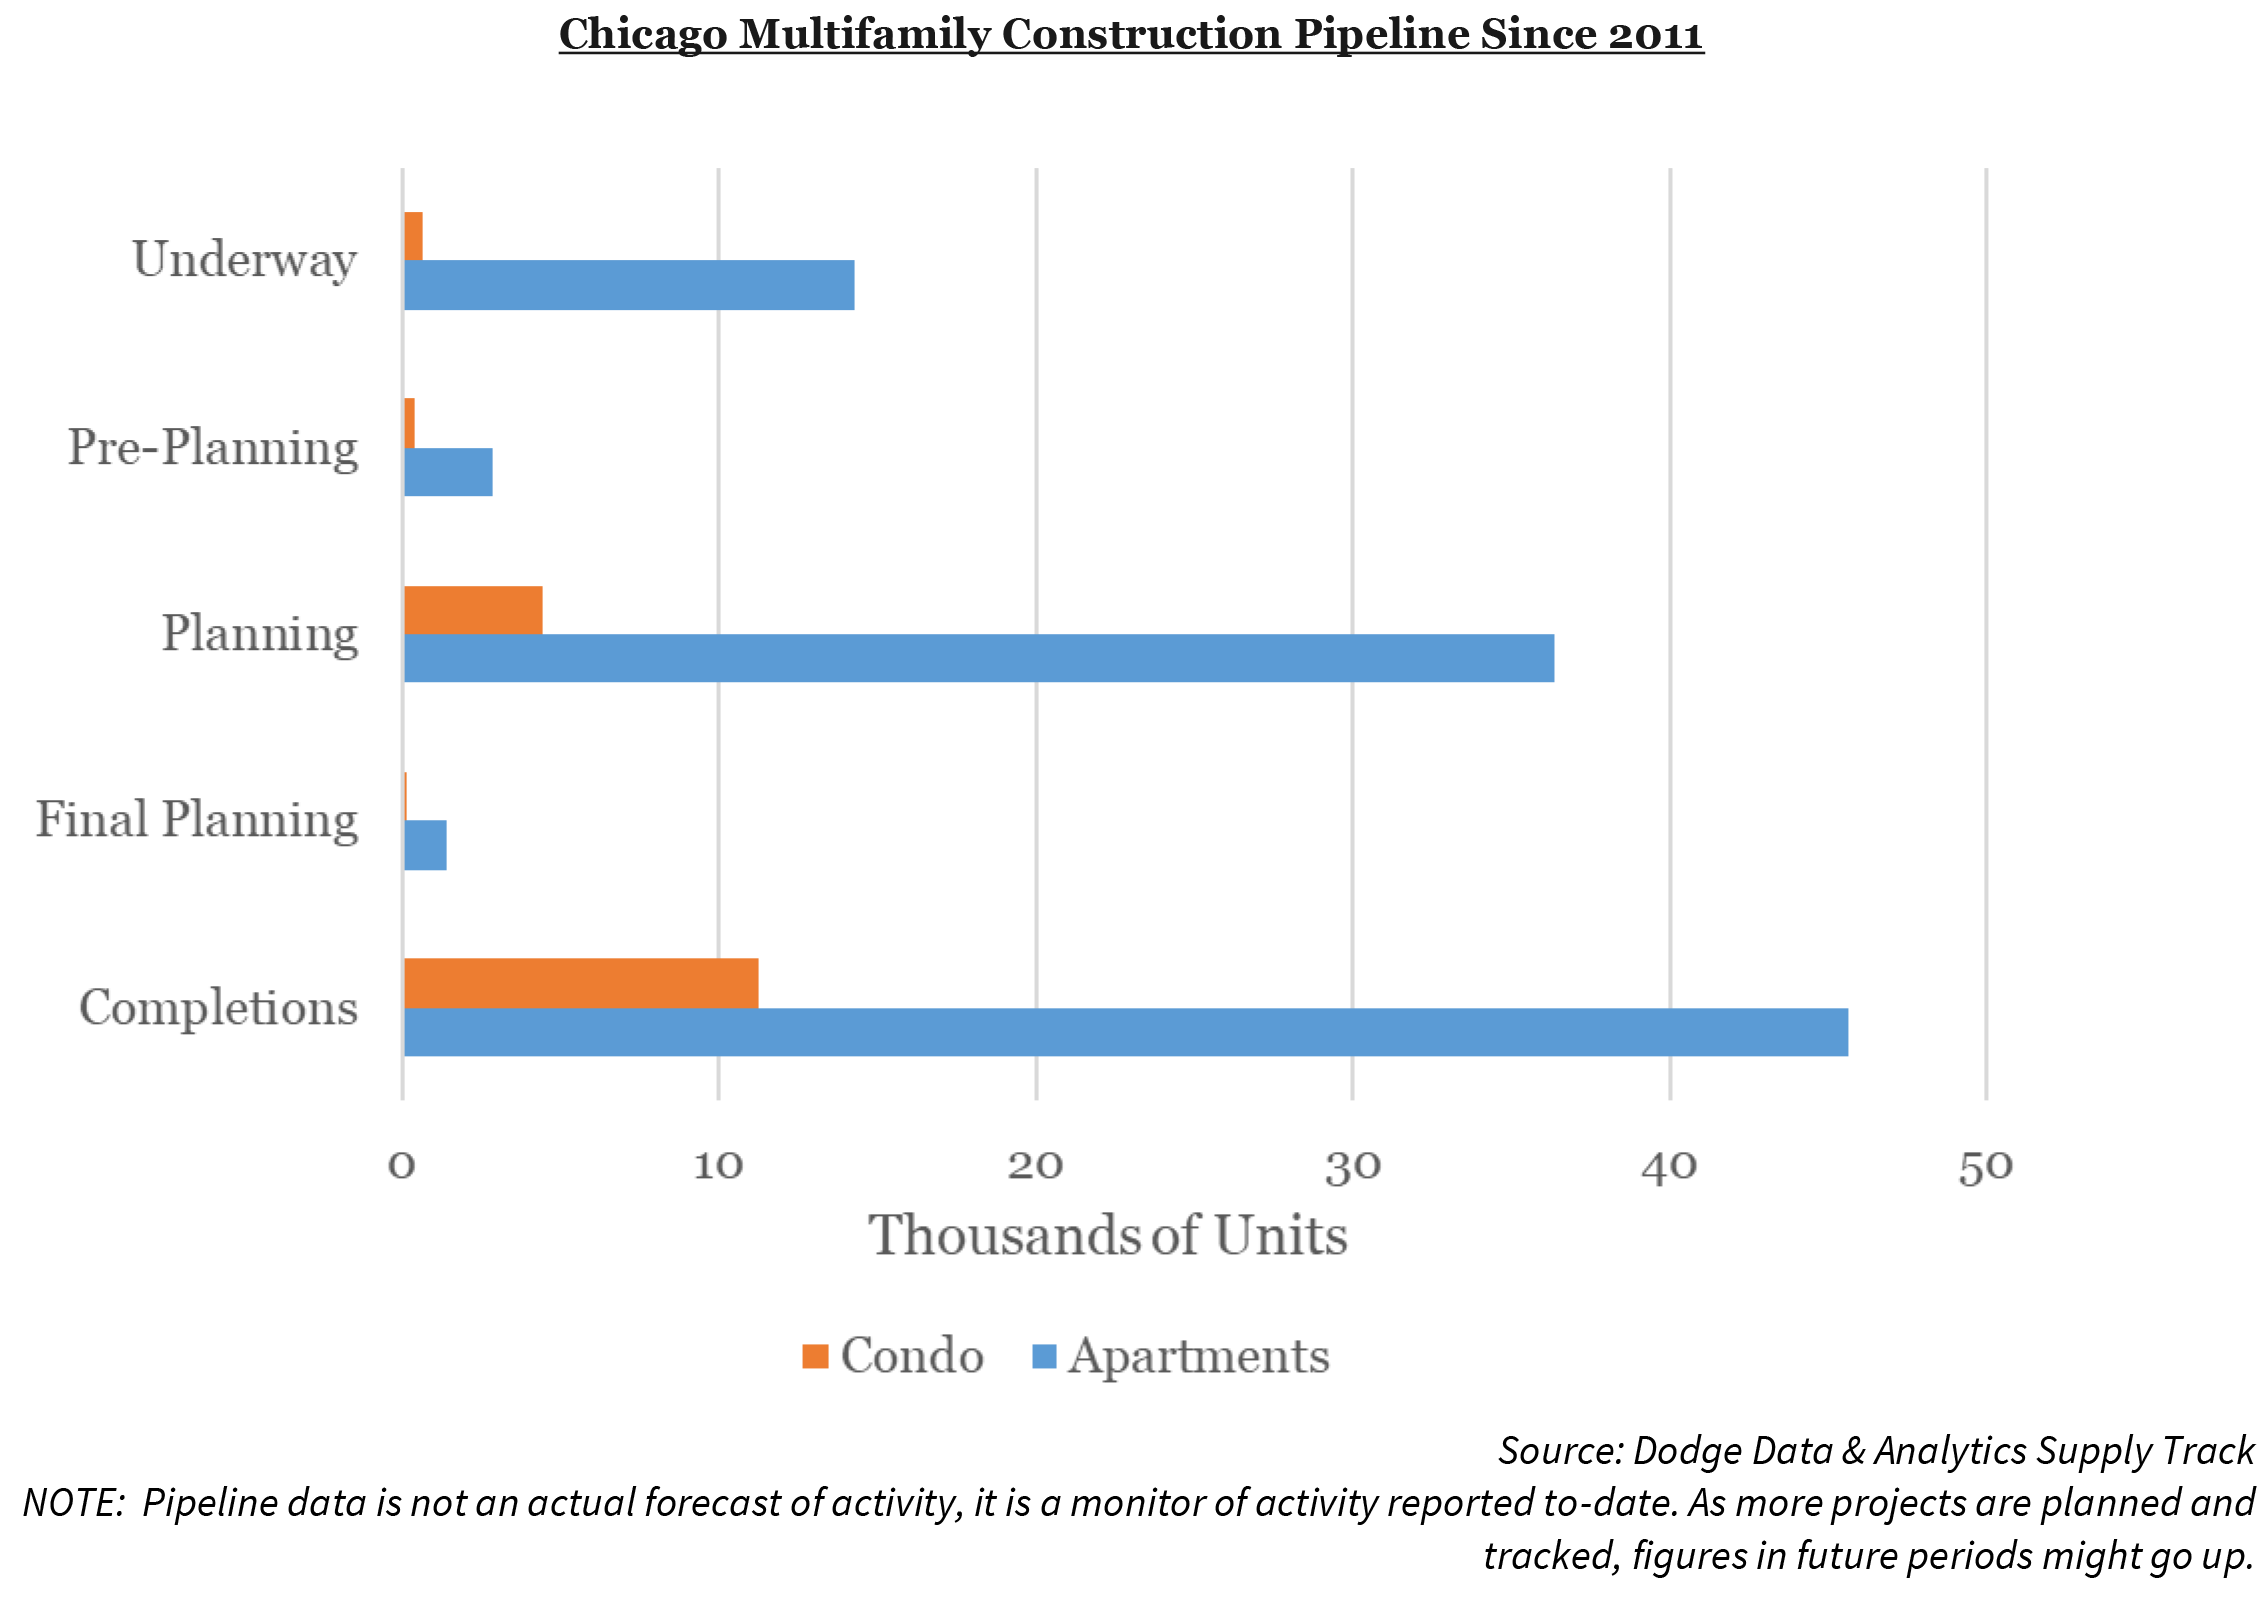
The RS Means survey results for multifamily construction in Chicago were fairly average among the cities surveyed. Still, Chicago is neither expensive nor an easy city to build in, but rather right in line with the findings of the cost and difficulties of the surveyed cities. Since 2011, approximately 46,000 apartments have been added to the Chicago metro area. Of the 46,000 apartment units added, the highest amounts of activity took place in 2017 and 2018 when approximately 19,000 apartments units came online.
Furthermore, the activity has stayed on pace with previous years. There are approximately 14,000 apartment units underway scheduled for delivery through 2020. Even though projects in the planning stages of the construction pipeline could deliver later than estimated, there is still a substantial amount of activity in the planning stages pipeline for Chicago, at approximately 41,000 apartment units.
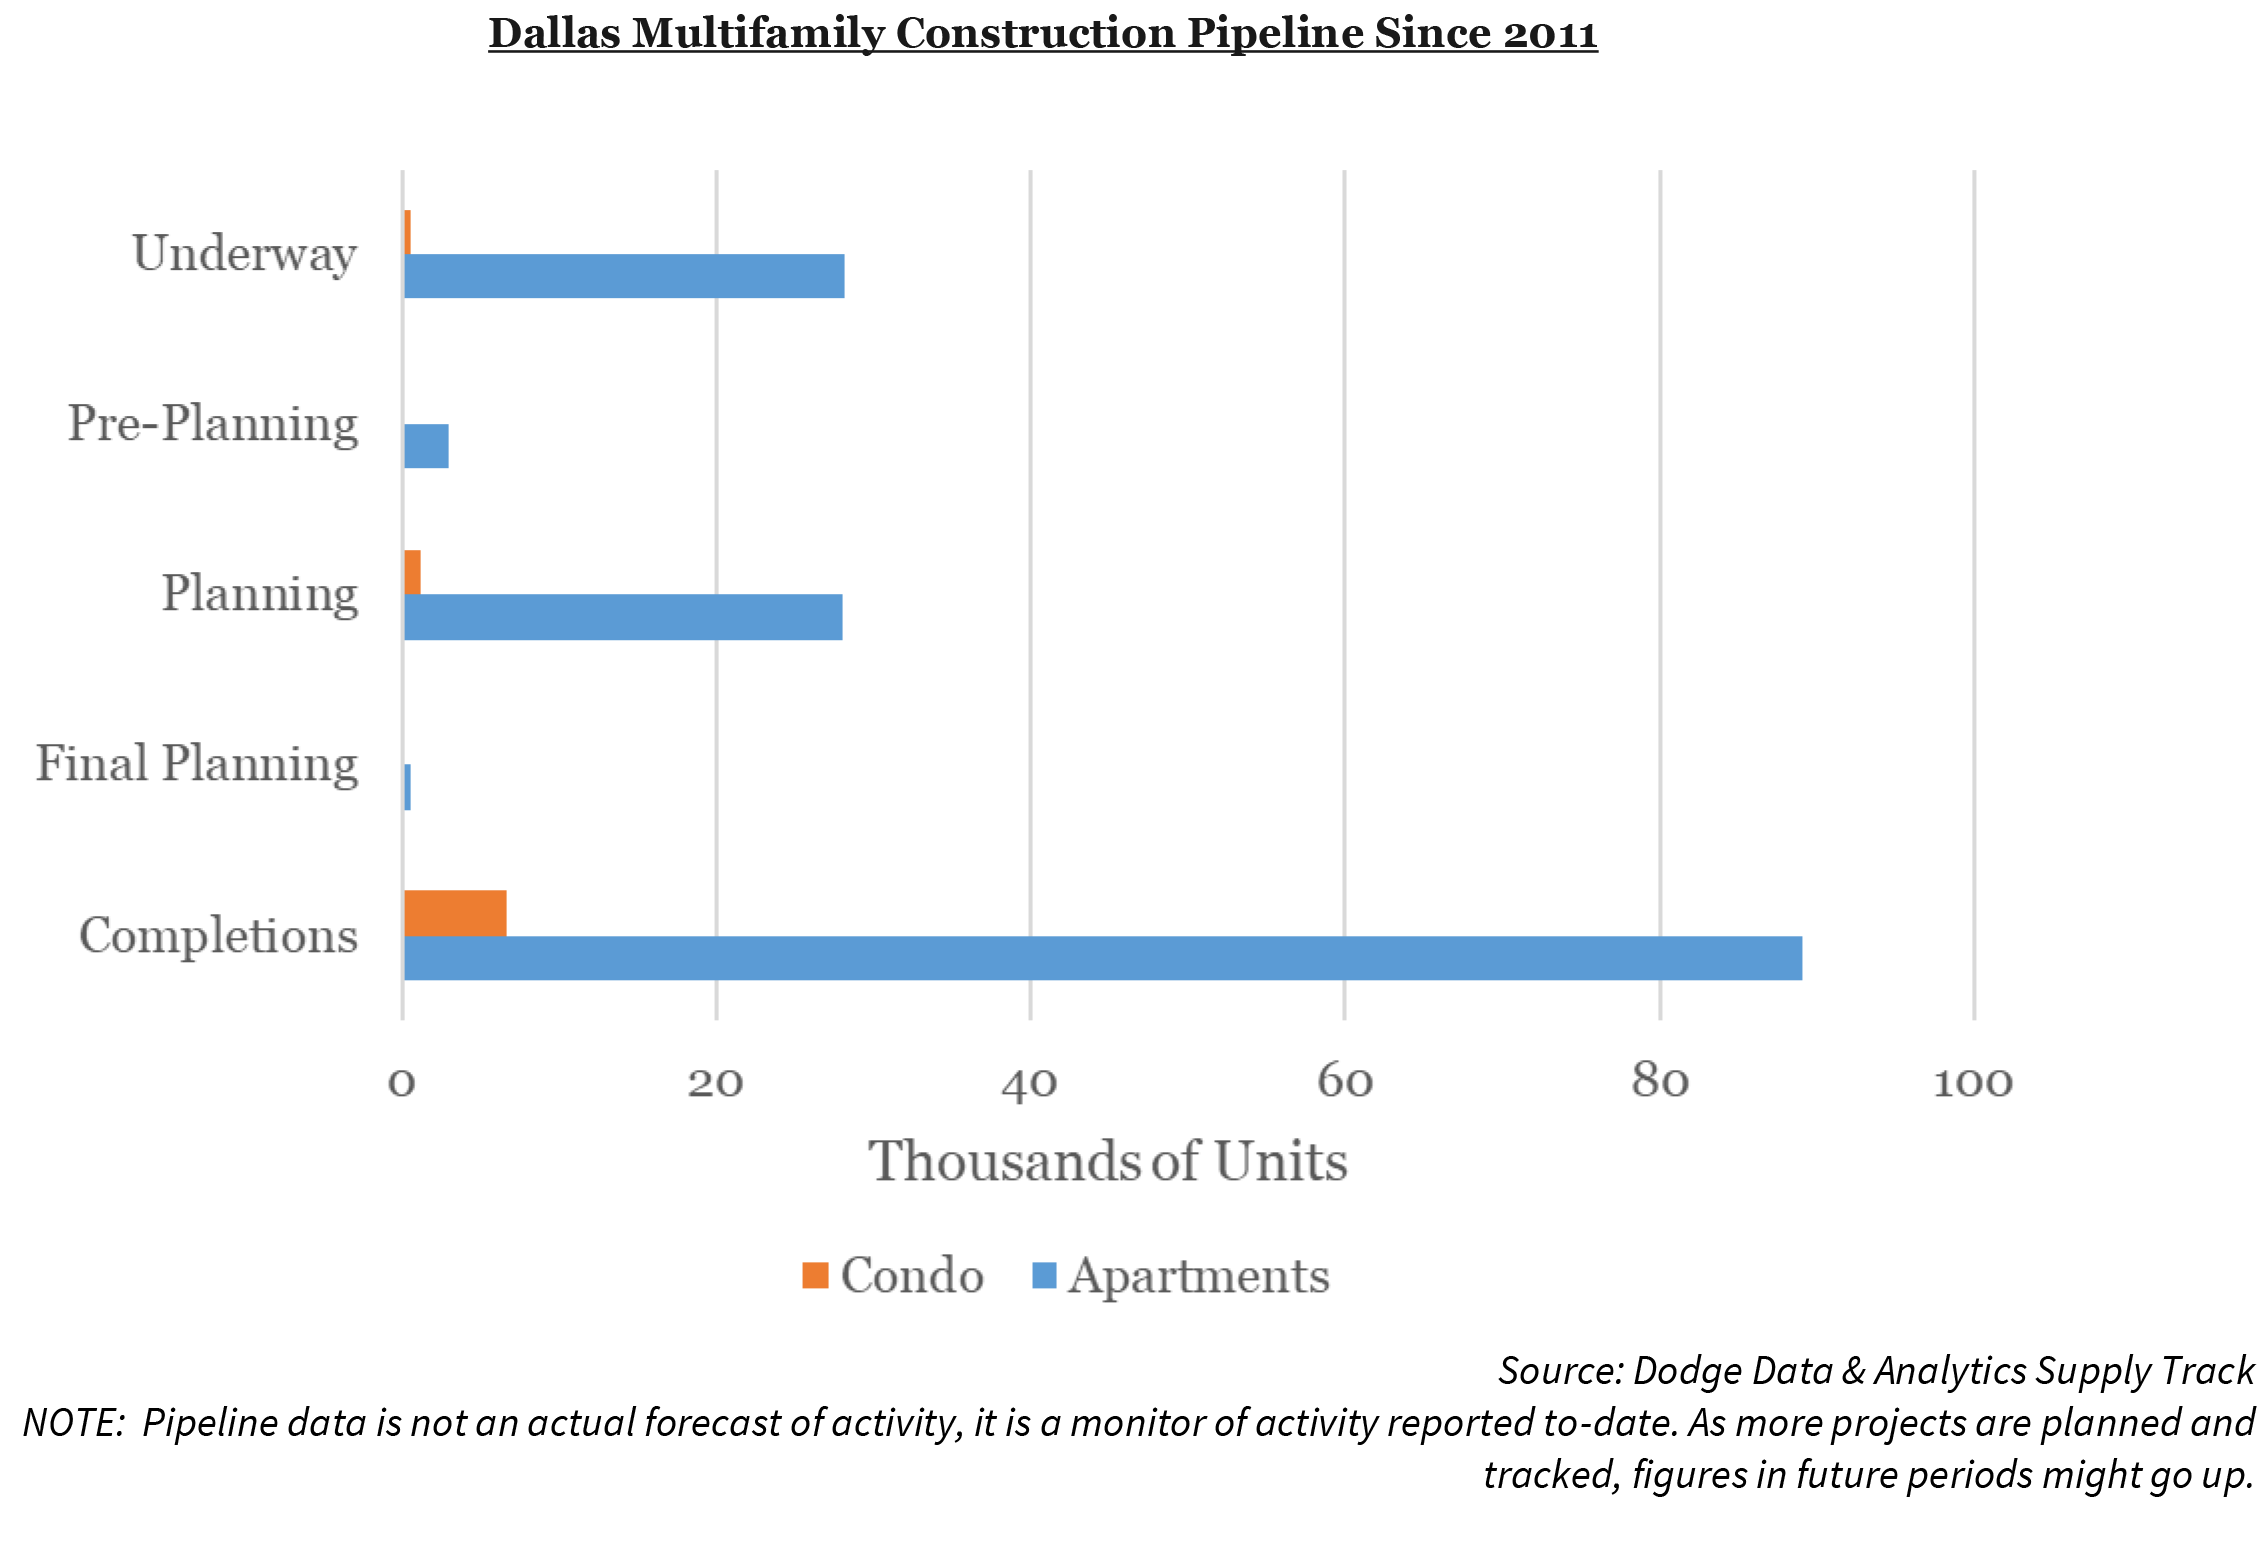
Dallas Multifamily Pipeline Fairly Robust
Over the last decade, industry chatter indicated that constructing housing, both single-family and multifamily, in all of Texas is not difficult, and the RS Means survey results appear to confirm this assessment. Of all the six cities included in the survey, Dallas was the least expensive and quickest city for developers to complete a multifamily construction project.
Since 2011, approximately 89,000 apartments have been added to the Dallas city area. Of these 89,000 apartments, the bulk of the metro’s activity has taken place over the last three years, when approximately 47,000 apartments have come online.
Furthermore, the activity has not slowed down. As seen in the chart, there are approximately 28,000 apartment units underway scheduled for delivery through 2020. There is still a substantial amount of expected multifamily activity in the construction pipeline for Dallas, with more than 32,000 apartments in various planning, underway, and completion stages.
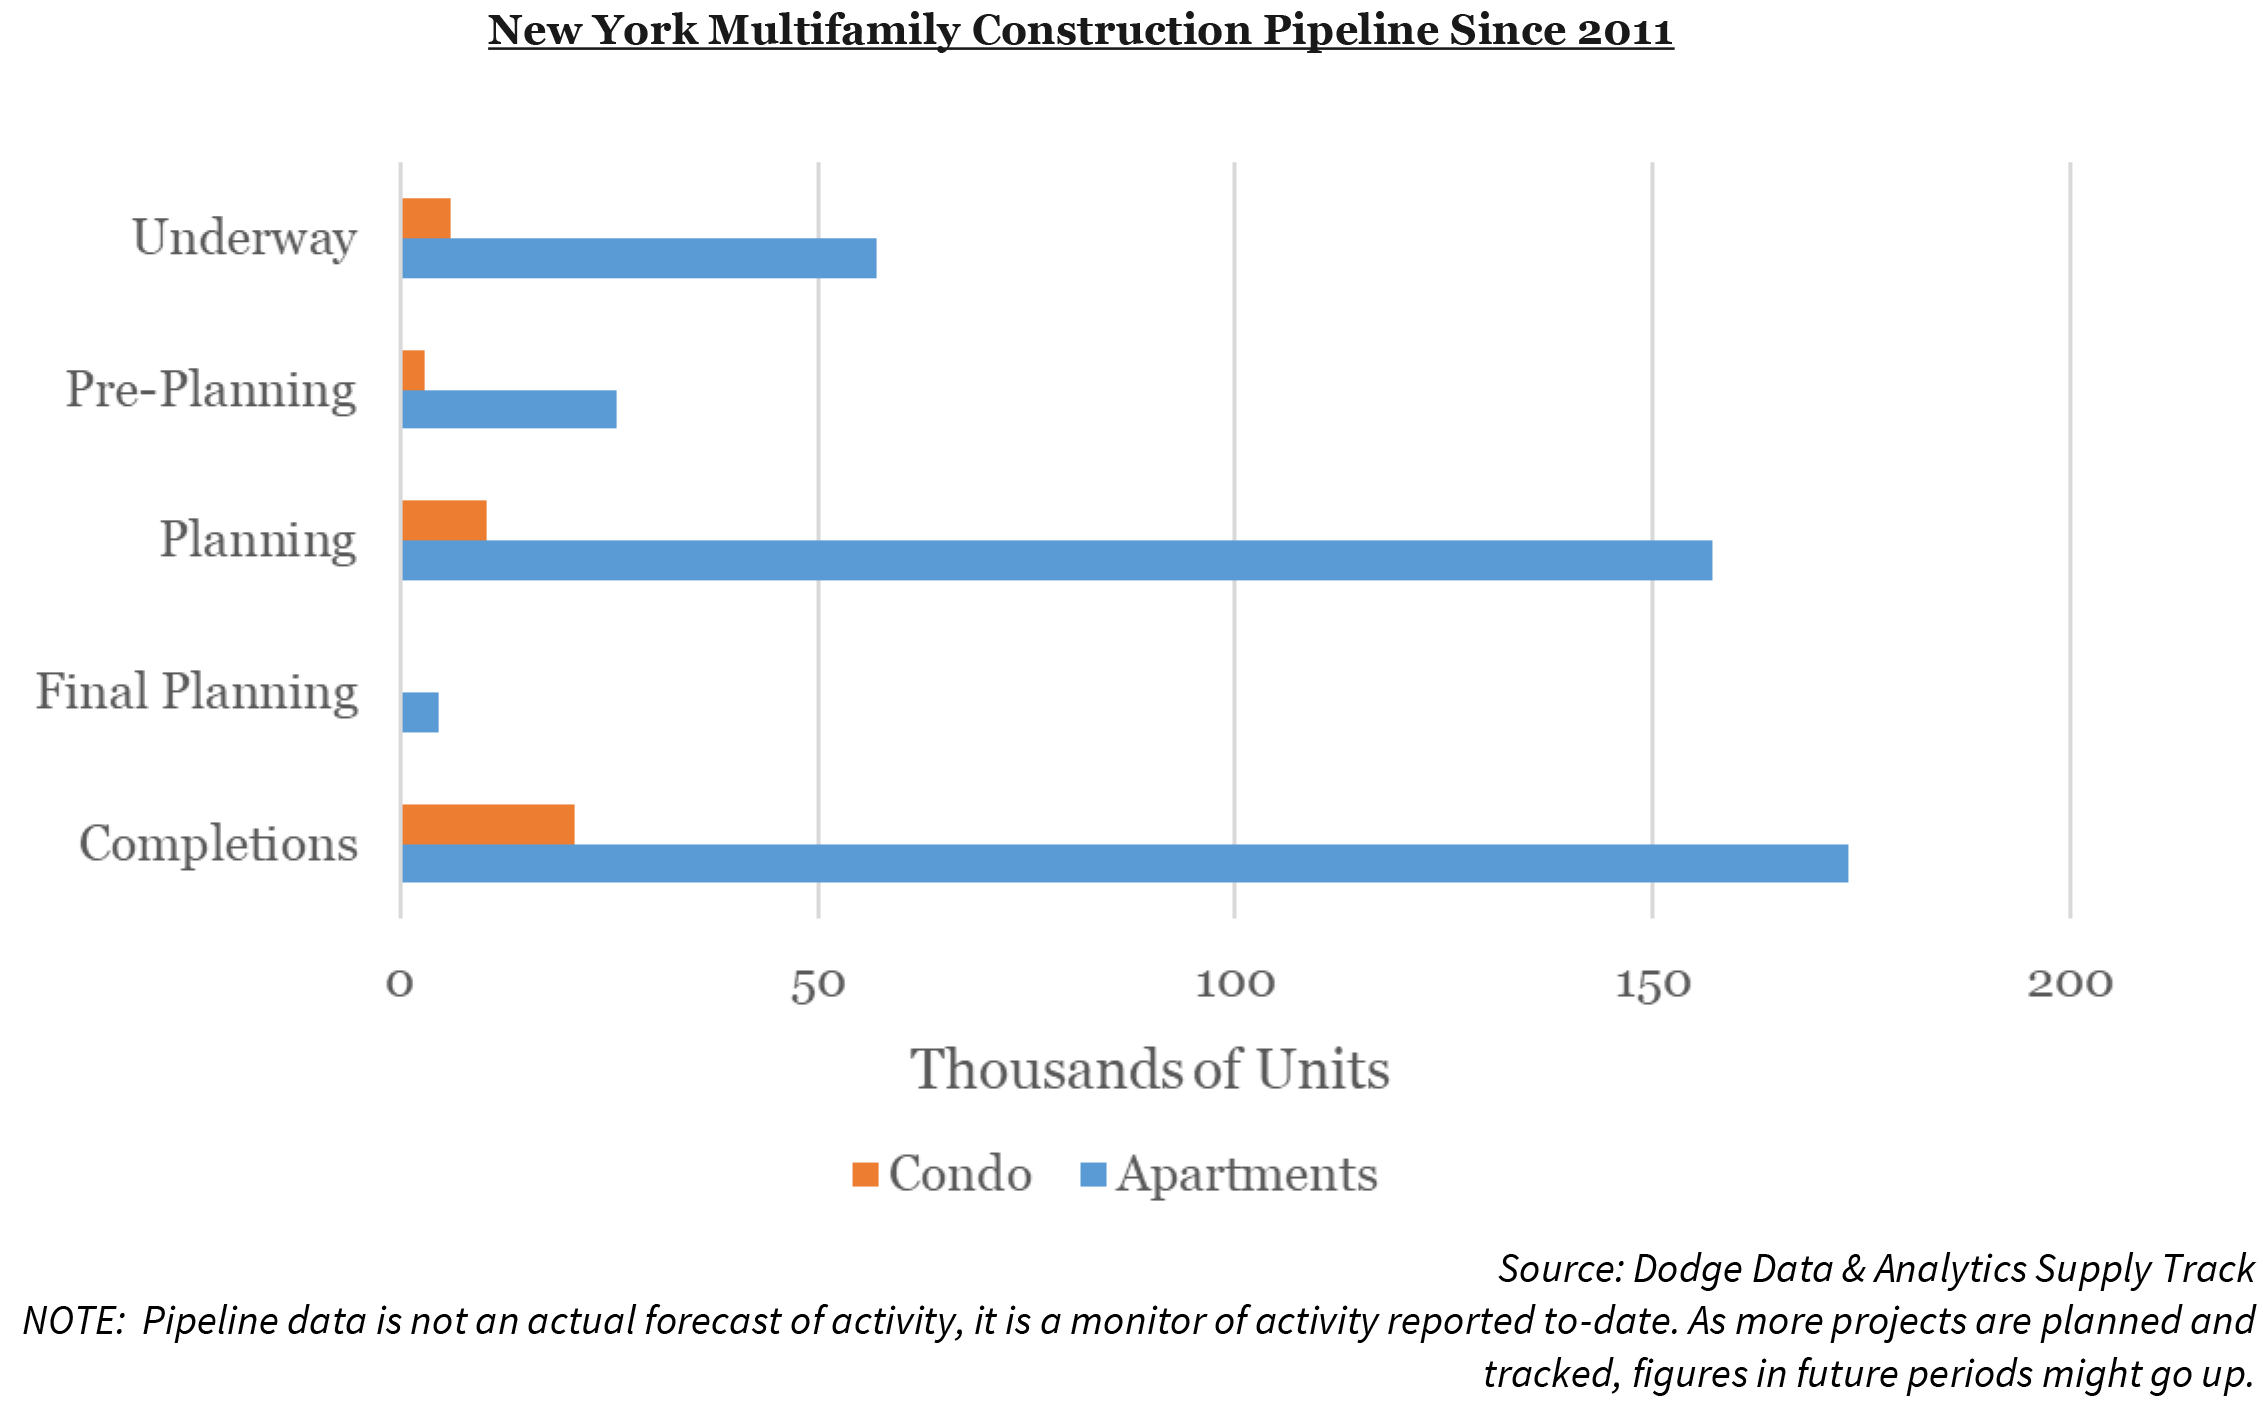
New York Multifamily Pipeline
The New York City metro area is expensive on all fronts, and, as shown in the survey results, multifamily construction costs in the city proper are among the most expensive in the nation. Of the six cities surveyed, New York was the most expensive in regard to hard costs, soft costs, and certain aspects of regulation and permitting.
That level of expense has not stopped developers from building both in the city and in the area. Since 2011, approximately 174,000 apartments have been added to the New York City metro area. Of these 174,000 apartments, approximately 102,000 have come online over the past three years.
Activity has slowed down slightly. There are approximately 57,000 apartment units underway scheduled for delivery through 2020 and approximately 188,000 apartments in various stages of planning in the New York metro multifamily construction pipeline.
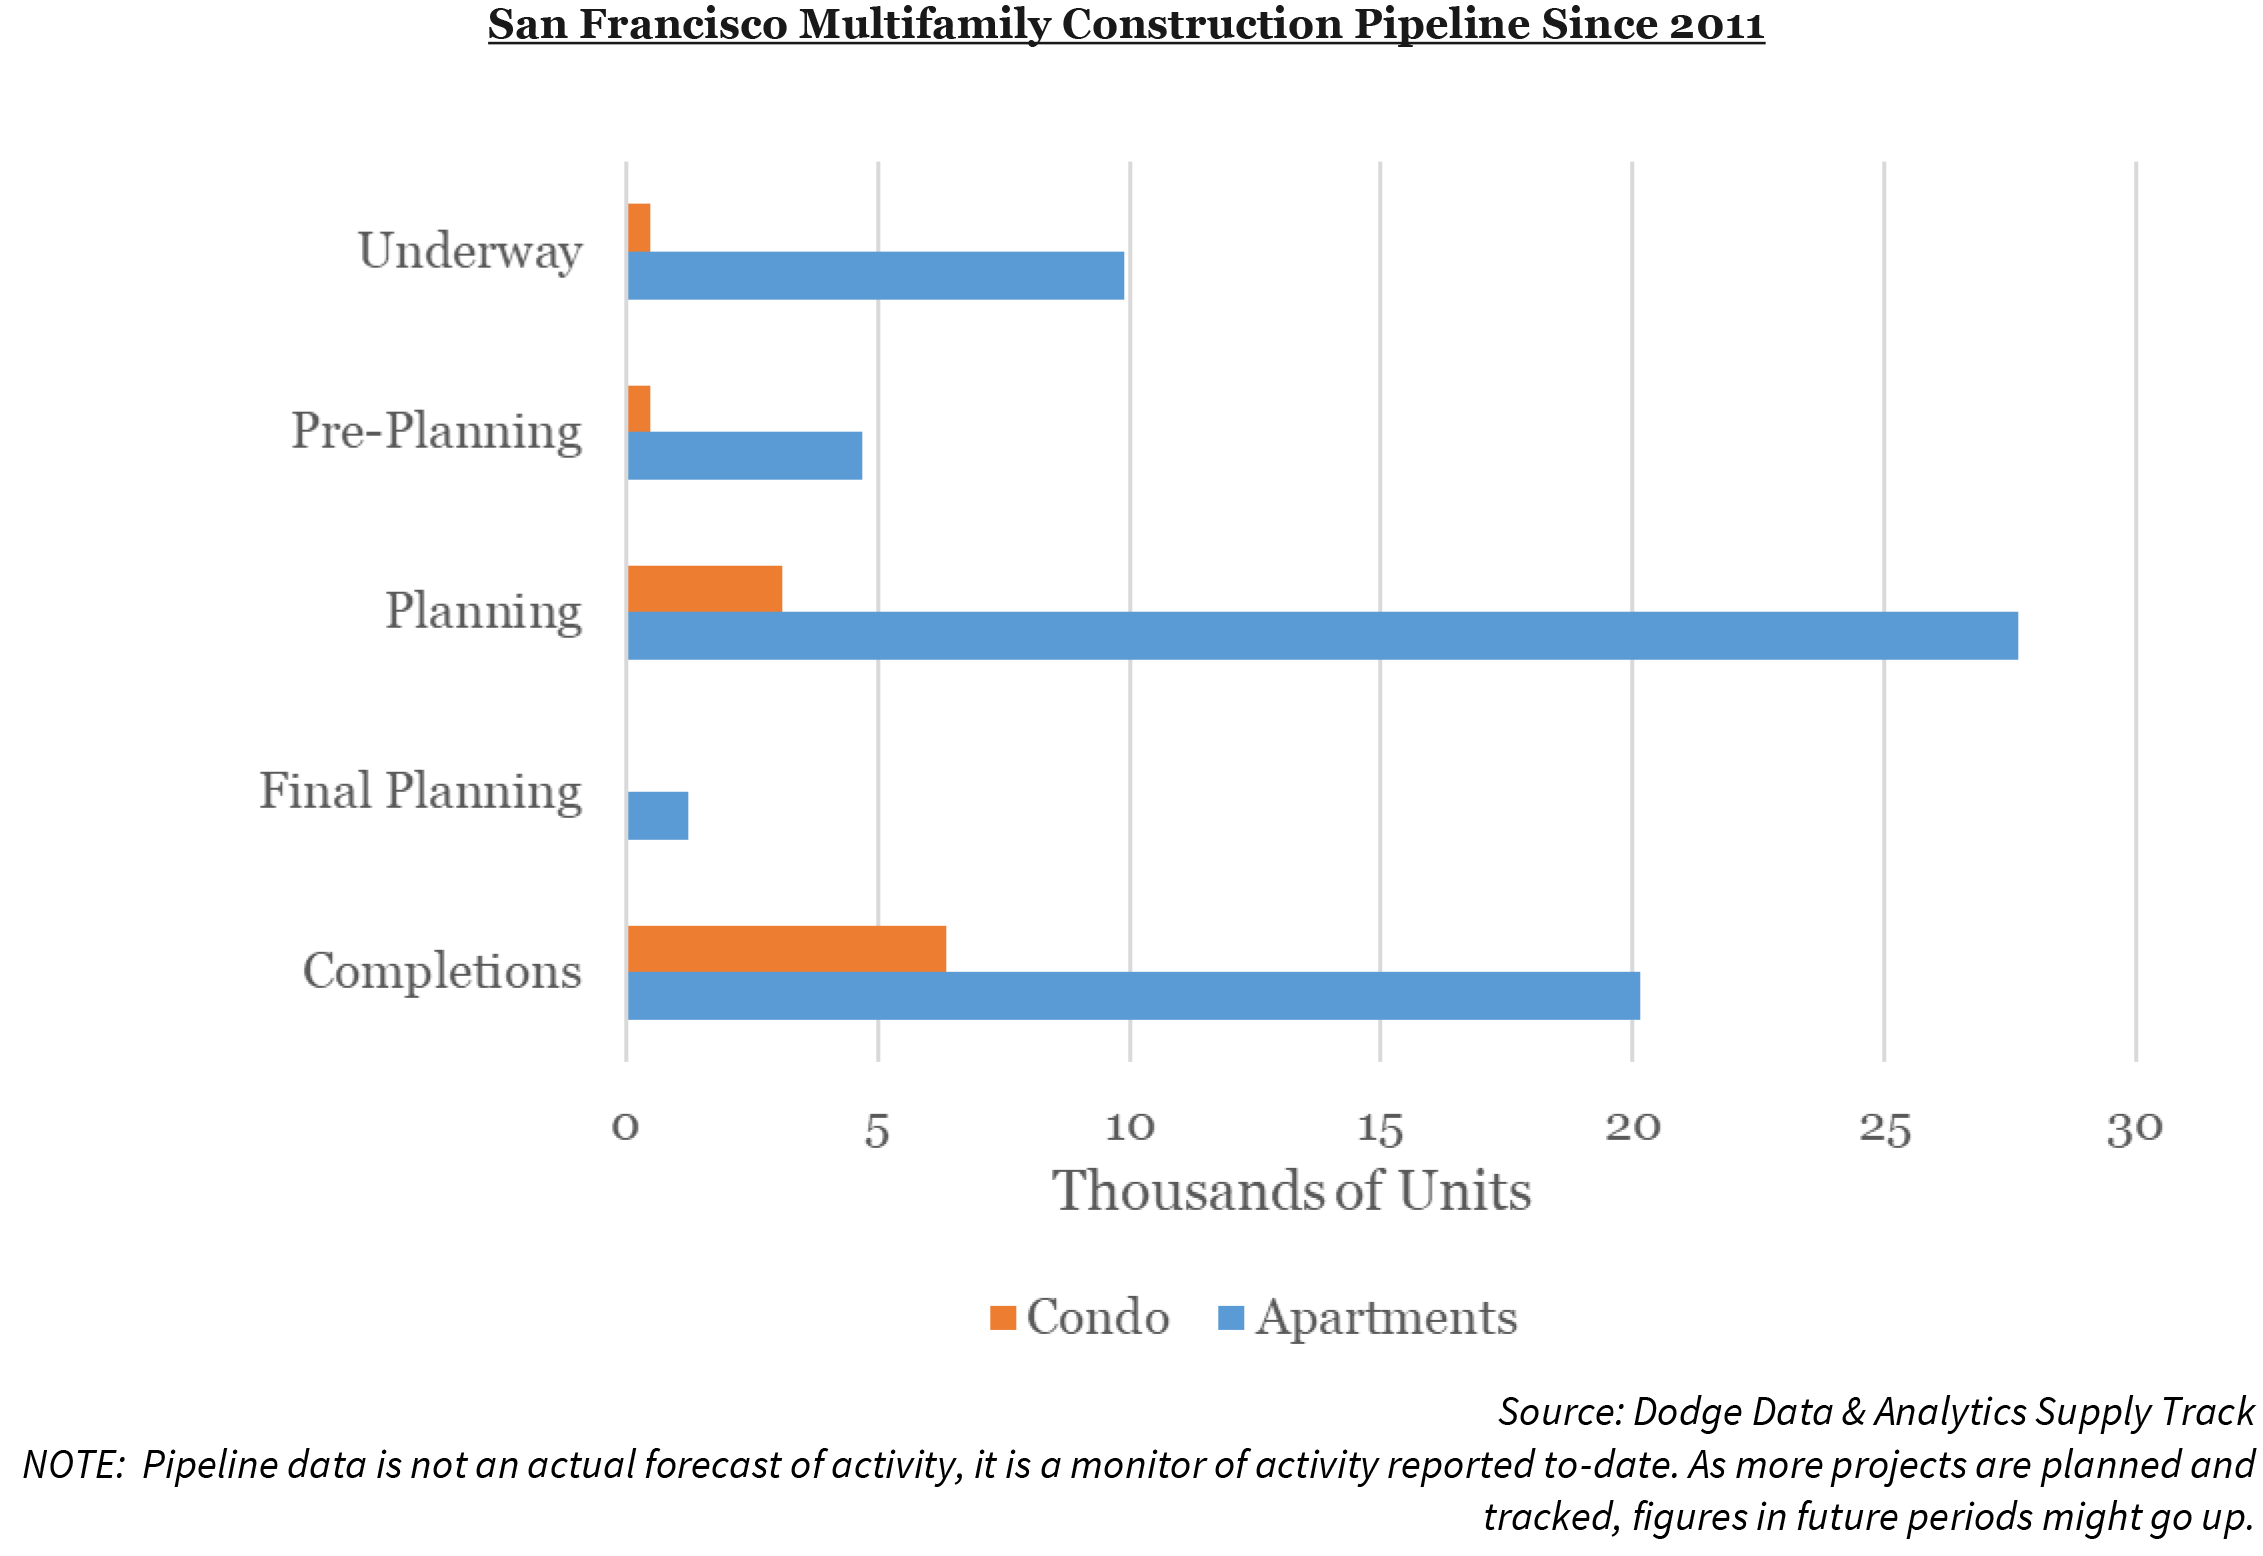
San Francisco Multifamily Pipeline
Of the six cities surveyed, San Francisco was right on par with New York in regard to having the most expensive hard costs, soft costs, and regulation and permitting costs. In addition, the survey results suggest San Francisco has some of the biggest hurdles to face in regard to time delays from permitting and compliance costs.
One likely result is that San Francisco’s pipeline activity has been much less rampant than other metros. Since 2011, approximately 20,000 apartments have been added to the San Francisco metro area. Of the 20,000 apartments added to the city, the bulk of the metro’s activity has taken place over 2016-2017, during which approximately 7,600 apartments came online.
Furthermore, the activity is on pace to reach new levels of development. There are approximately 10,000 apartment units underway scheduled for delivery through 2020 and approximately 34,000 apartments in various stages of planning in the multifamily construction pipeline.
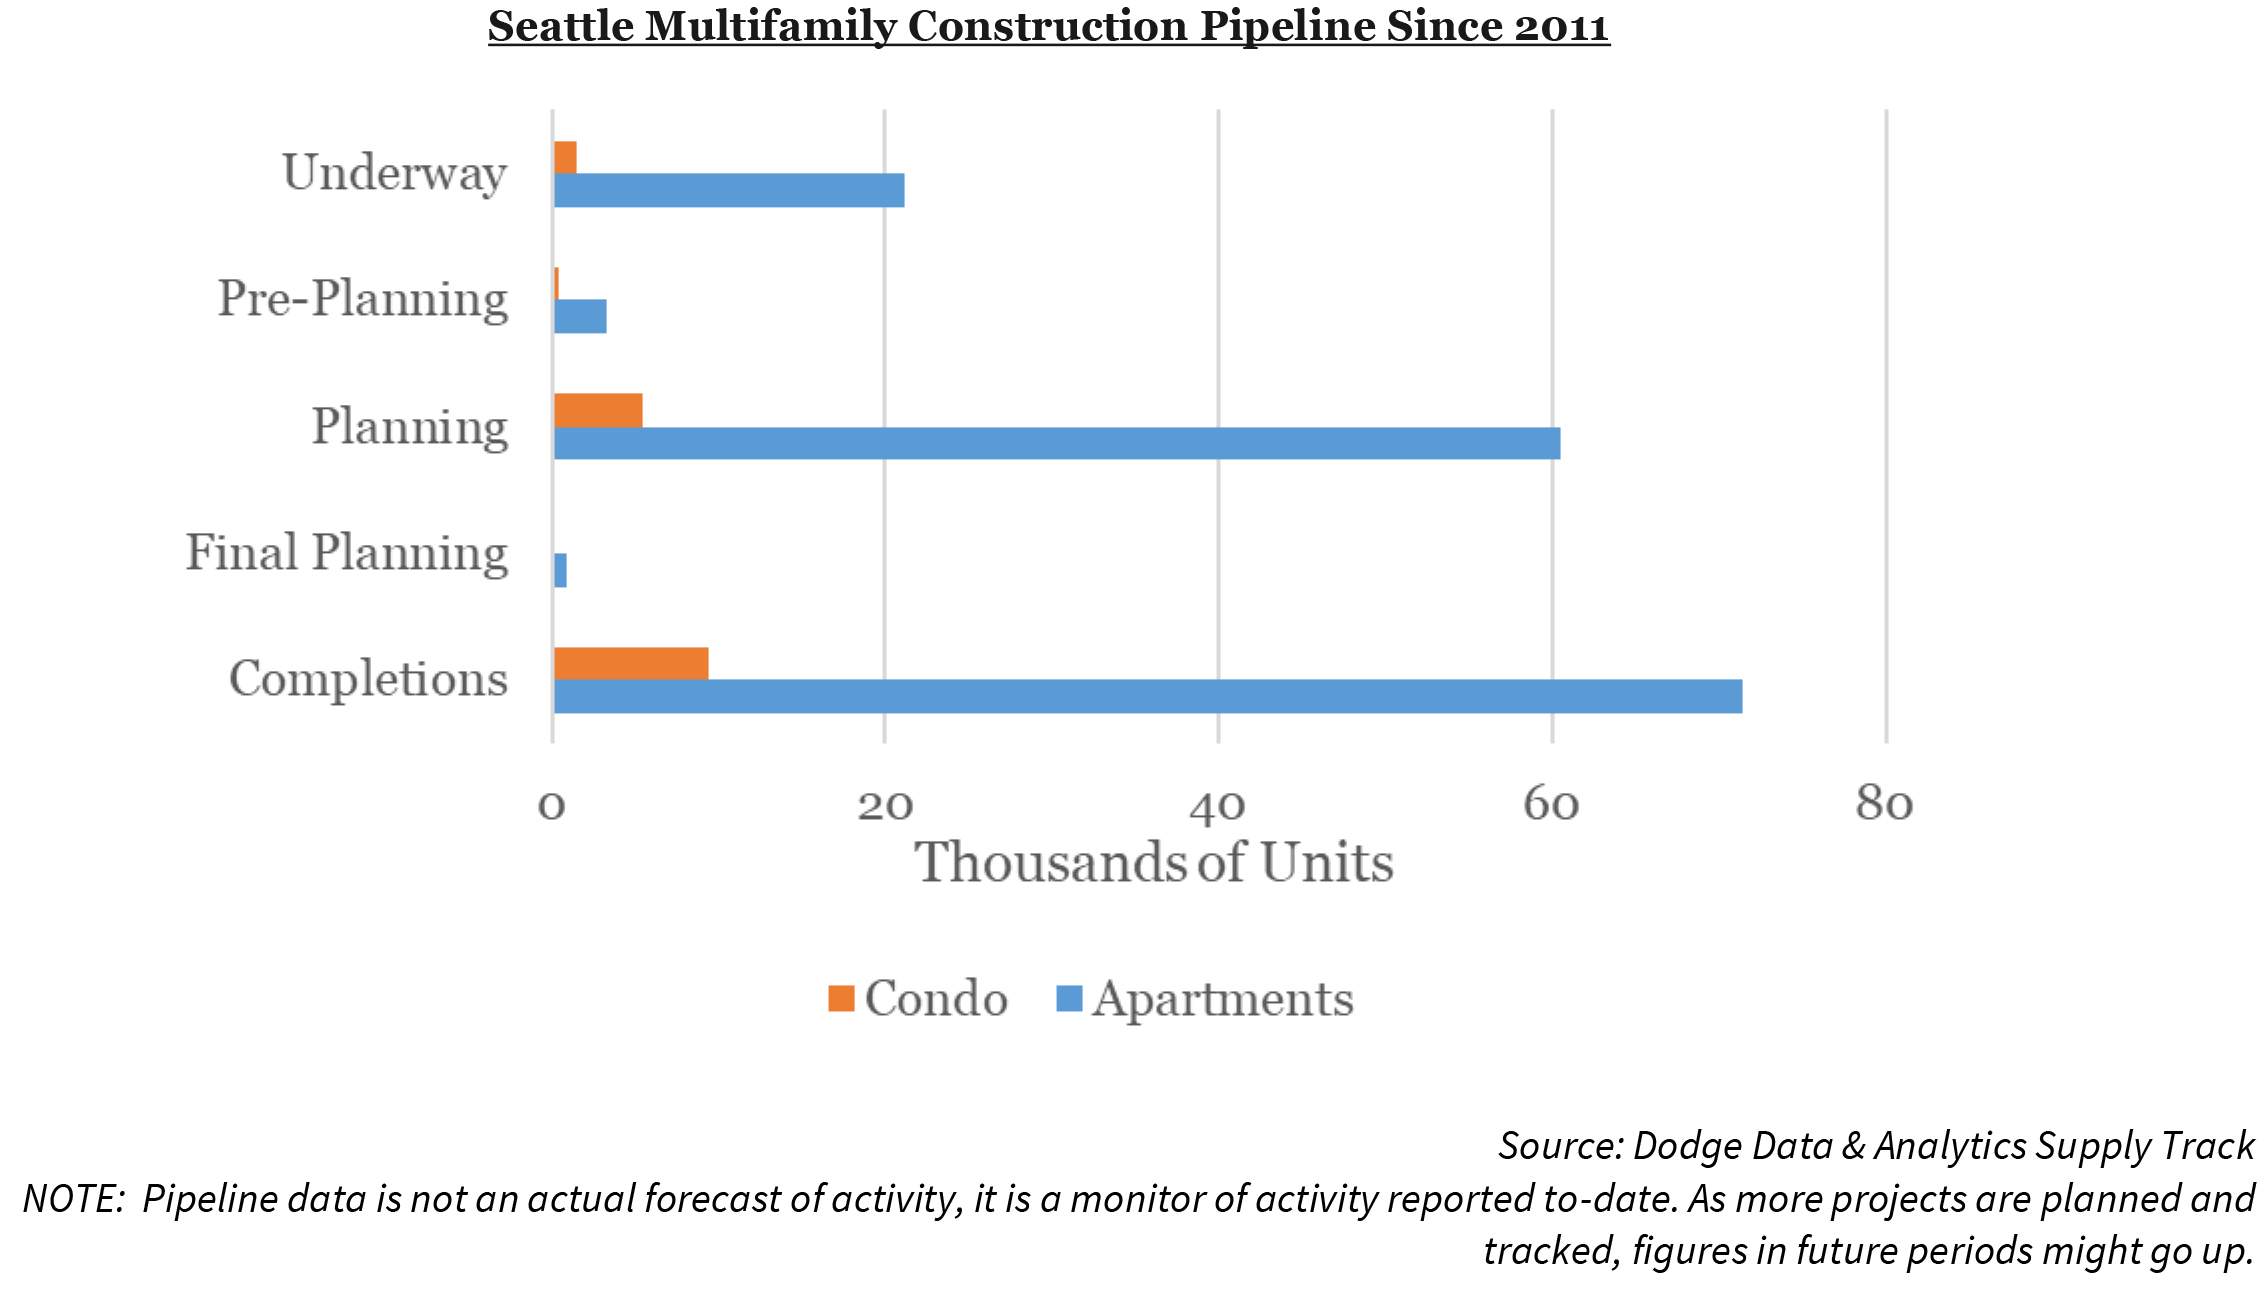
Seattle Multifamily Pipeline Considered Average
The survey results for multifamily construction costs and timelines in Seattle were considered average. Since 2011, approximately 71,000 apartments have been added to the Seattle metro area. Of the 71,000 apartments, the highest amounts of activity took place in 2017 and 2018 when approximately 28,000 apartments came online.
Furthermore, the activity has stayed on pace with previous years. There are approximately 21,000 apartment units underway scheduled for delivery through 2020 and approximately 65,000 apartments in various stages of planning in the multifamily construction pipeline.
Developers Remain Undeterred Despite Ongoing Cost and Labor Shortages
Labor issues continue to be an ongoing problem in the industry. Overall, the survey revealed that labor issues have the potential to worsen as there are fewer construction workers and those that are available are getting older. And yet the demand for multifamily units remains elevated, due to continued job growth, demographics, and increased rental household formations.
Multifamily developers remain optimistic about current and future demand for multifamily units and seem undeterred by protracted project timelines, labor issues, and overall costs. Yet, as a result, it appears that developers feel that only higher- end multifamily projects are worth the investment in most of these cities, further exacerbating the dearth of affordable multifamily units. The survey results clearly demonstrate that the industry cannot simply build its way out of the housing affordability problem. Other alternative and innovative solutions are also needed.
Francisco Nicco-Annan
Economist
Multifamily Economics and Market Research
September 2019
Opinions, analyses, estimates, forecasts and other views of Fannie Mae's Multifamily Economics and Market Research Group (MRG) included in these materials should not be construed as indicating Fannie Mae's business prospects or expected results, are based on a number of assumptions, and are subject to change without notice. How this information affects Fannie Mae will depend on many factors. Although the MRG bases its opinions, analyses, estimates, forecasts and other views on information it considers reliable, it does not guarantee that the information provided in these materials is accurate, current or suitable for any particular purpose. Changes in the assumptions or the information underlying these views could produce materially different results. The analyses, opinions, estimates, forecasts and other views published by the MRG represent the views of that group as of the date indicated and do not necessarily represent the views of Fannie Mae or its management.