At the onset of the pandemic, dramatic economic shocks resulted in millions of people around the nation losing their jobs. Since most renters residing at multifamily Low Income Housing Tax Credit (LIHTC) properties rely on employment income to pay their rent, there was some concern about the potential impact of the sudden recession and lingering economic after-effects of the pandemic on these types of properties. Unlike certain other federally assisted housing programs, renting a LIHTC unit does not guarantee that a renter household will spend no more than 30 percent of its income on rent and utilities. Because less than a third of LIHTC residents are also covered by Project-Based Section 8 rental assistance, many LIHTC renters could spend more than 30 percent of their household income on housing costs. Nevertheless, fundamentals at LIHTC properties remained stable between 2019 and 2022 and, in some cases, outperformed similar conventional properties, including Market Rate Seniors Housing – Majority Independent Living (Market Rate Seniors) and Market Rate Class B/C properties.
LIHTC Seniors Vacancy Trends Stable
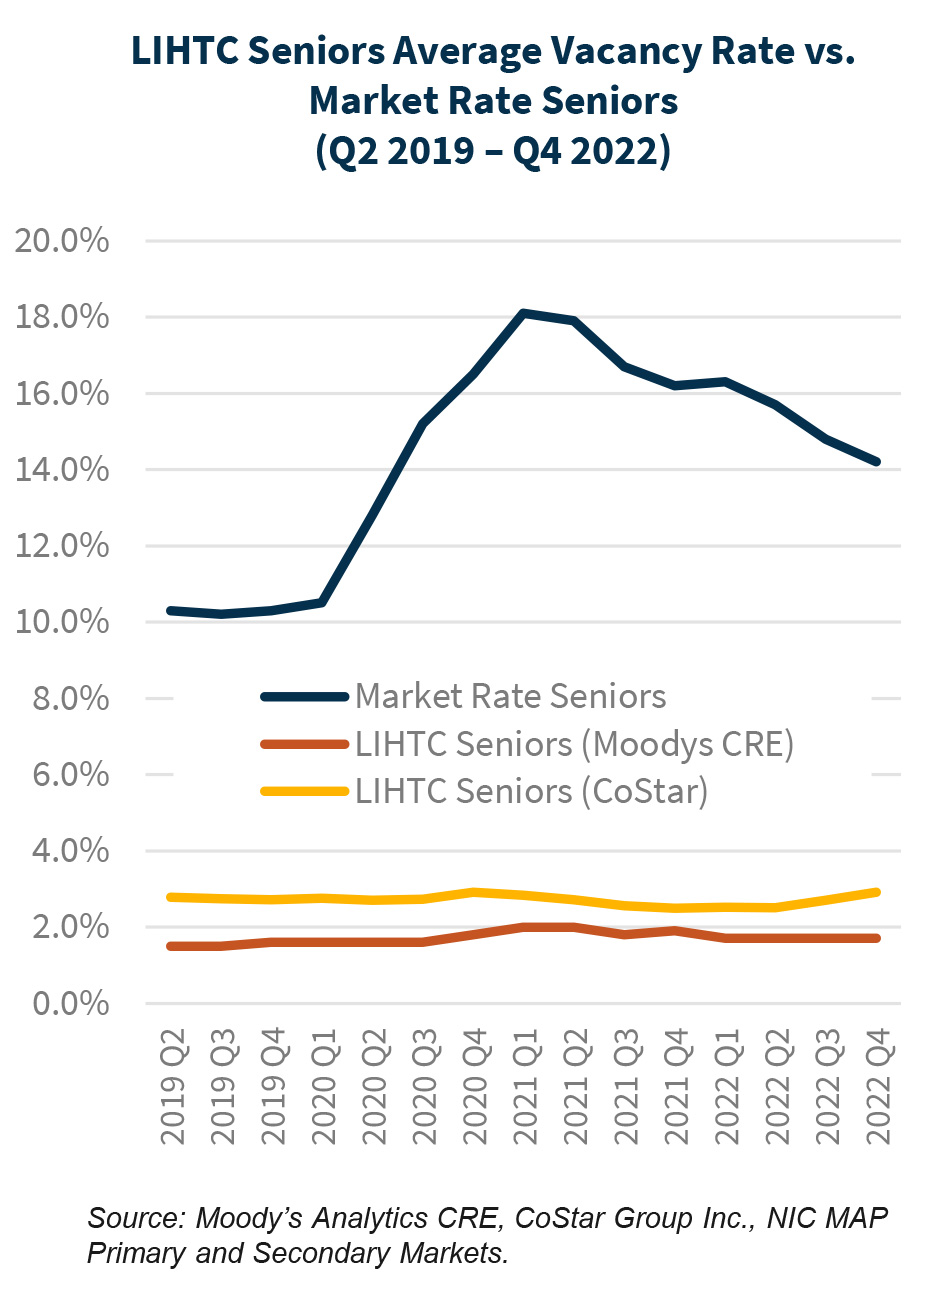
As shown in the chart below, both Moody’s Analytics CRE and CoStar data show the average vacancy rate barely moved at LIHTC Seniors properties even at the height of economic recession in 2020. Prior to the roll-out of the COVID-19 vaccine, many seniors housing properties experienced some of the highest COVID-19 infection and death rates, leading to an increase in their overall vacancy rate as some residents with means likely moved out. However, the vacancy rate at LIHTC Seniors properties only rose by 0.4 percent from Q4 2019 to Q1 2021 to a high of 2 percent, according to data from Moody’s Analytics CRE, with the vacancy rate now back in line with its pre-pandemic average. CoStar data shows a similar trend, with the average vacancy rate hovering around 2.7 percent.
Market Rate Seniors housing fared much worse. The average vacancy rate at these properties rose by 7.8 percent points from Q4 2019 to Q1 2021 to a high of 18.1 percent. While the vacancy rate has been stabilizing – declining to 14.2 percent as of Q4 2022 – it remains much higher than the 1.7 percent average vacancy rate at LIHTC properties.
The lower vacancy rate for LIHTC Seniors properties is likely due to these lower-income residents simply having fewer housing options, keeping them from moving out. In addition, many of these seniors have a stable source of income in Social Security and are paying rents that are much lower than those offered at Market Rate properties.
LIHTC Seniors Rents Much Lower
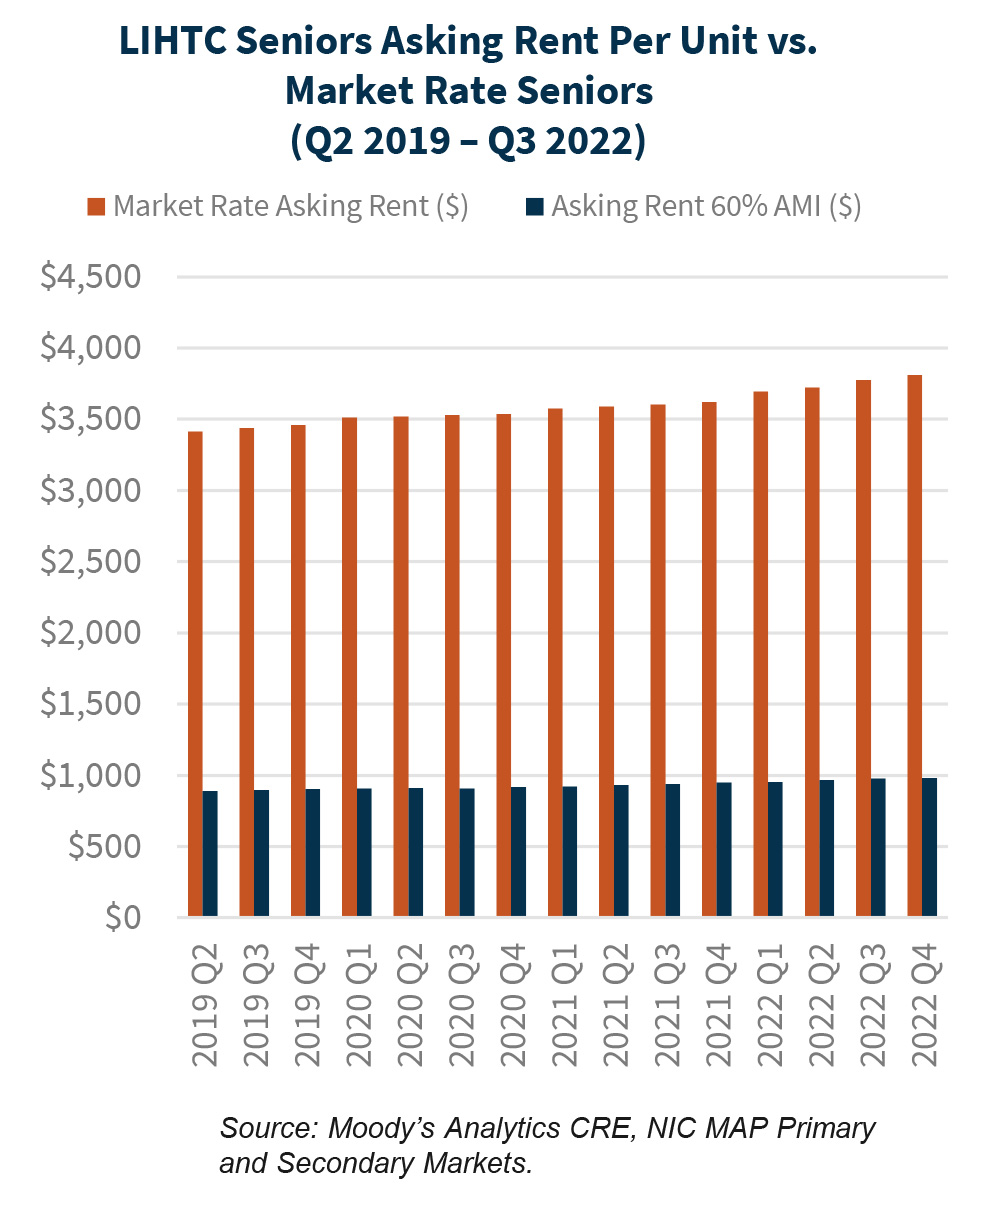
As shown in the chart below, Moody’s Analytics CRE data estimates that the average asking rent at LIHTC Seniors properties for units affordable at 60 percent of Area Median Income (AMI) is generally only about a quarter of the rent at Market Rate Seniors properties.
In fact, despite double digit vacancy rates, rents have continued to grow at Market Rate Seniors properties with the average asking rent increasing to $3,811 as of Q4 2022 from $3,460 as of Q4 2019. By contrast, the average asking rent at LIHTC Seniors properties for units affordable at 60 percent of AMI only increased to $982 as of Q4 2022 from $904 as of Q4 2019.
However, it is important to note that Market Rate Seniors housing properties offer far more amenities and personal services than what is available at Seniors LIHTC properties.
LIHTC Family Vacancy Trends Also Stable
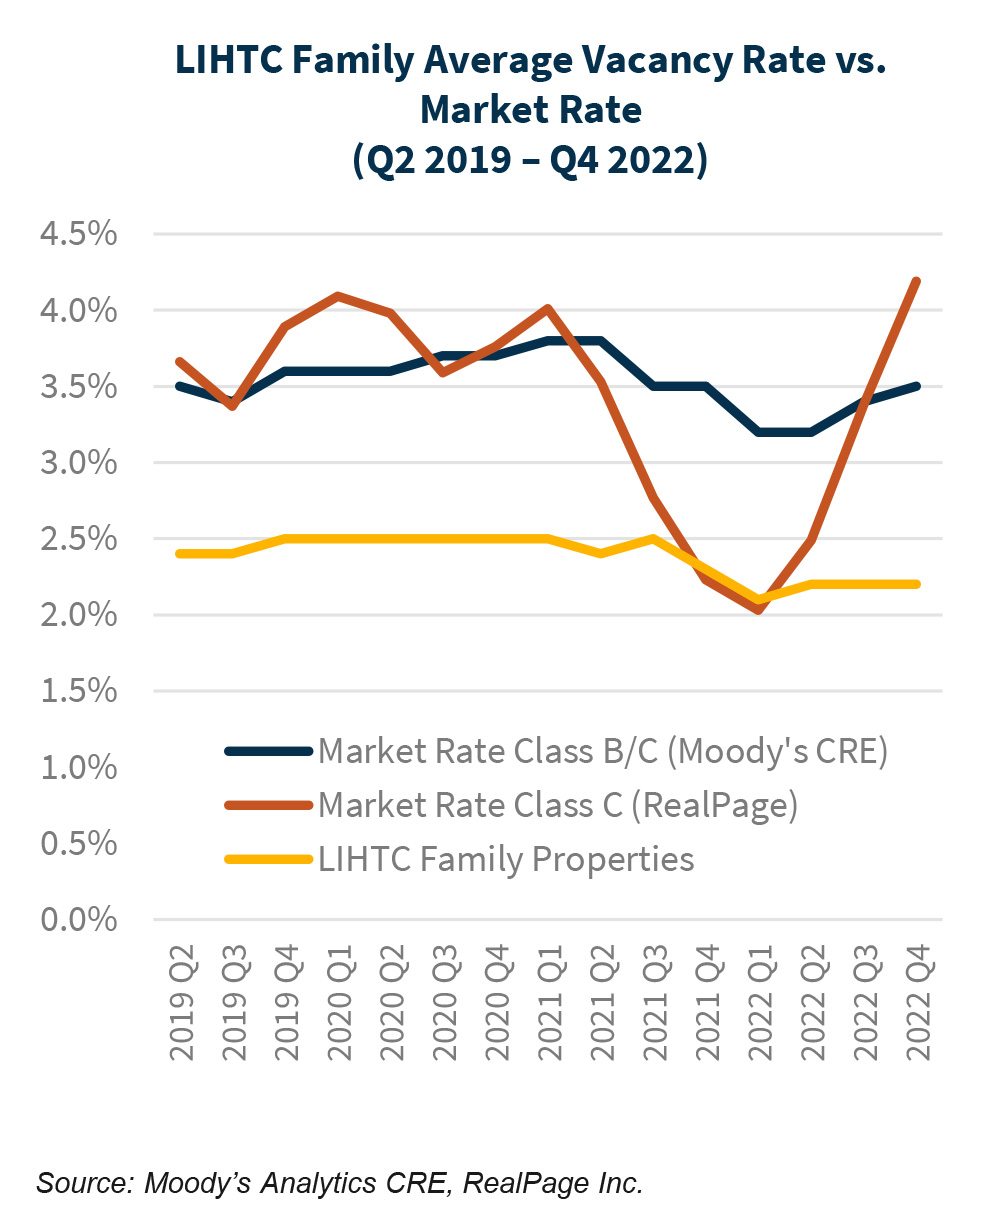
As shown in the chart below, Moody’s Analytics CRE data estimates the average vacancy rate remained unchanged at LIHTC Family properties even at the height of the economic recession in 2020. The vacancy rate at LIHTC Family properties remained at 2.5 percent from Q4 2019 to Q3 2021 before declining to 2.2 percent as of Q4 2022.
The closest comparable market rate segment also tracked by Moody’s Analytics CRE, Market Rate Class B/C, also remained fairly stable with the average vacancy rate rising by just 0.2 percentage points over the same time period. But it had a higher average vacancy rate of 3.8 percent as of Q1 2021 before falling and rebounding to 3.5 percent as of Q4 2022. RealPage, which defines Class C properties as those with rents in the bottom 20 percent of a market, also estimates a slightly higher vacancy rate for Class C properties of 4.0 percent as of Q1 2021.
While vacancy at LIHTC properties is expected to be low by design, the stability of their lower average vacancy rate over the past several years demonstrates that the various federal stimulus programs, as well as a quickly rebounding job market, generally helped both tenants and borrowers of subsidized properties.
LIHTC Family Asking Rents Rose Fairly Steadily Through Q4 2022
Unlike Seniors LIHTC properties where residents have some guaranteed sources of income like Social Security, residents of LIHTC Family properties rely on continued employment to pay rent. However, some of the strongest income growth in recent years helped support the gradual but generally consistent increases in rent necessary to support the ongoing operation of LIHTC properties.
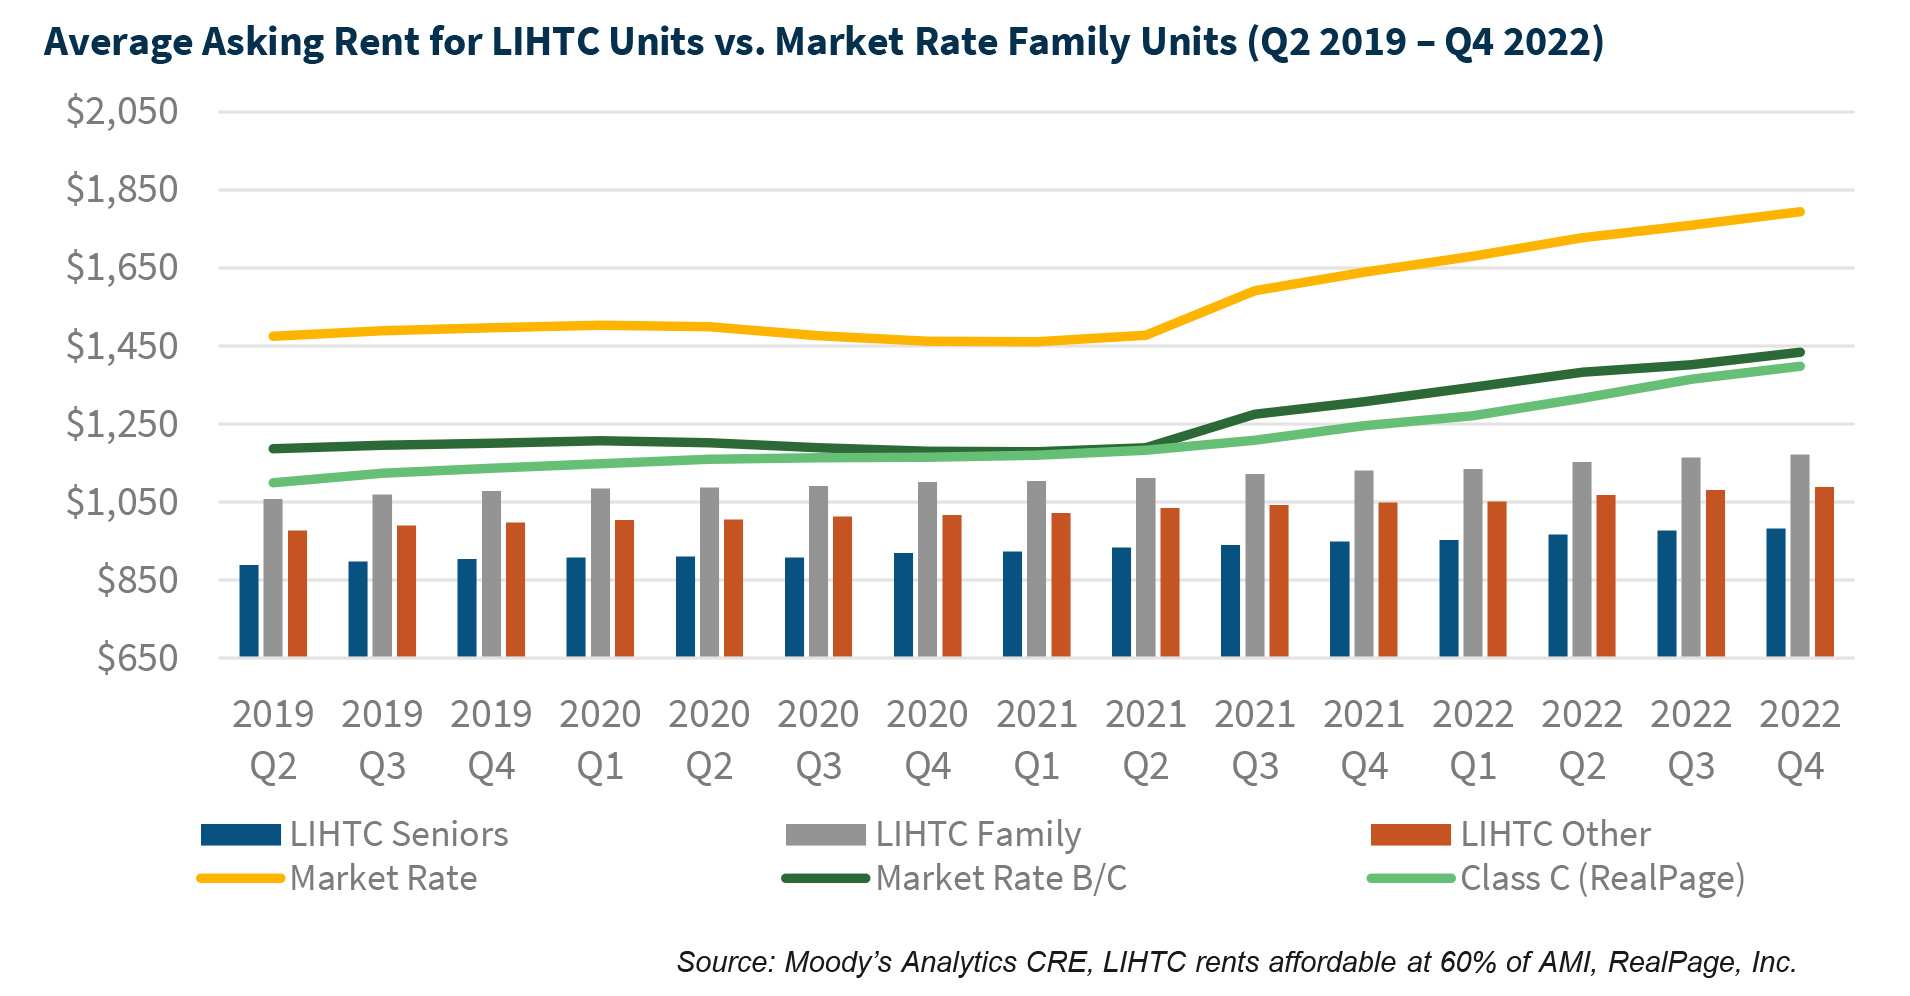
As shown in the chart below, LIHTC Family asking rents slightly exceeded Market Rate Class B/C properties during the height of the economic recession, according to Moody’s Analytics CRE data. While the Market Rate Class B/C average rent fell by - 2.3 percent from Q1 2020 to Q1 2021, the average rent at LIHTC Family properties rose by 1.7 percent.
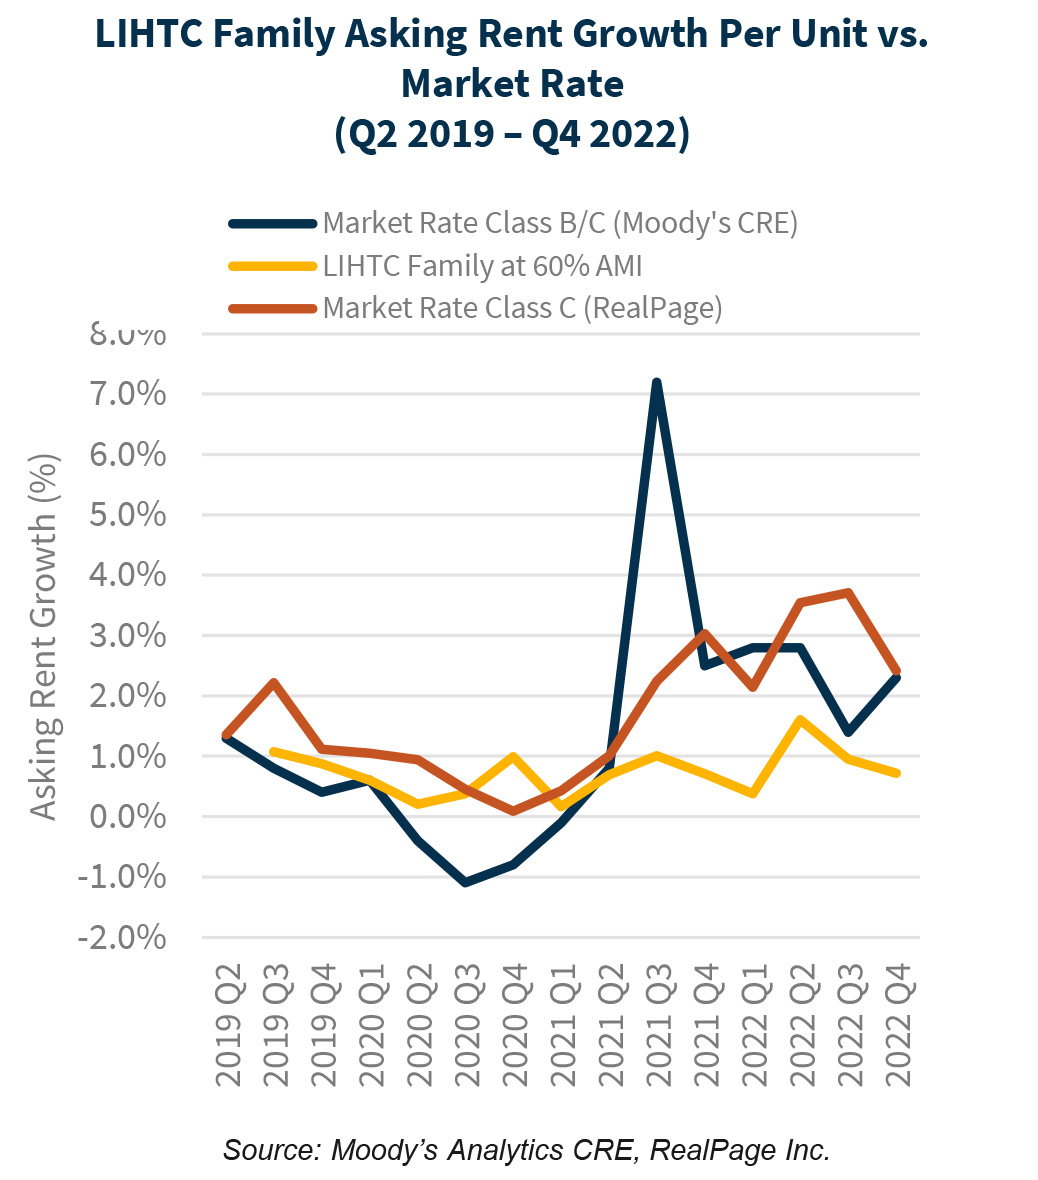
Nevertheless, even with the temporary decline, the average asking rent at Market Rate properties overall as of Q4 2022 was estimated at $1,794, about 53 percent higher rent than for units affordable at 60% of AMI at LIHTC Family properties as shown in the chart below. The average asking rent at Market Rate Class B/C properties was estimated by Moody’s Analytics CRE to be $1,434 as of Q4 2022, about 22 percent higher. RealPage, which defines Class C properties as those with rents in the bottom 20 percent of a market, estimated the average asking rent for Class C properties to be just under $1,400 as of Q4 2022 or about 19 percent higher.
Share of Rent Paid at LIHTC Properties Stable During Pandemic
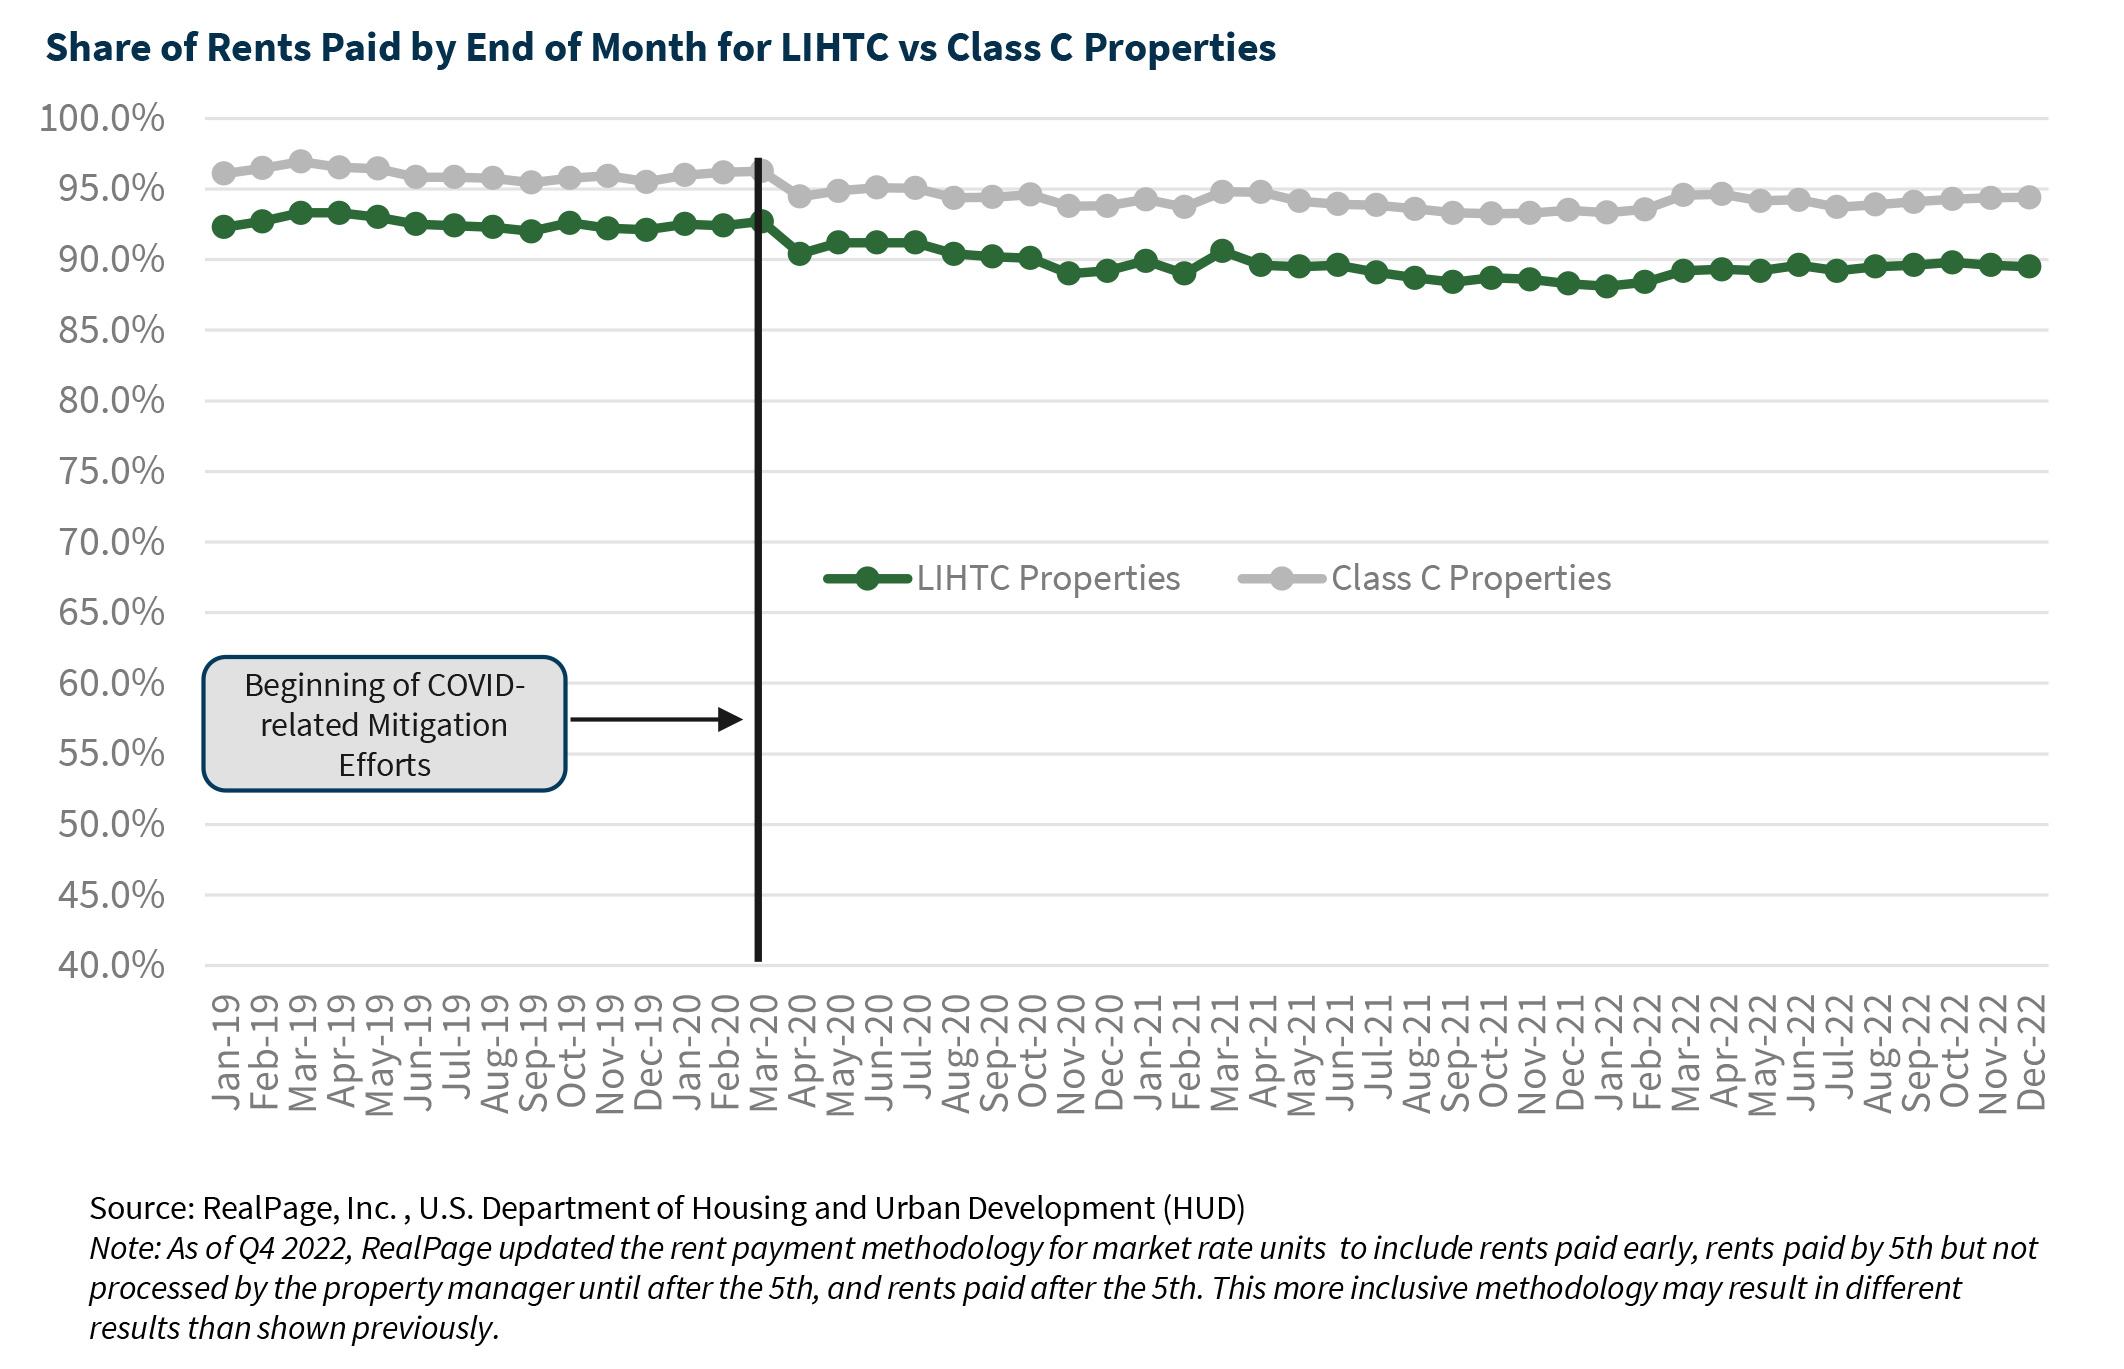
Most units at LIHTC properties are rented to residents earning no more than 60 percent of AMI. However, maximum rent increases are set by income limits released by the U.S. Department of Housing and Urban Development (HUD) and, in many non-coastal markets, rents for LIHTC units may be below the maximum allowable rents due to local market conditions. Therefore, federal stimulus payments, emergency rental assistance, and extended unemployment benefits were able to go further at LIHTC properties than at most types of market rate multifamily properties during the height of the economic lock-down during the pandemic. This supported steady fundamentals and the share of rents paid by month’s end hovered around 90% from April 2020 to March 2021.
Still, there has been some deterioration in both LIHTC and certain market rate properties in rents paid by month’s end since the start of the pandemic. RealPage defines Class C units as units in the bottom 20% of rents for a market. Rents paid by month’s end at Class C properties declined from 96.3% of all rents in March 2019 to 94.4% as of December 2022. In addition, rents paid at month’s end at LIHTC properties declined from 92.7% of all rents as of March 2019 to 89.5% as of December 2022.
We believe the multifamily sector may face softening demand in 2023 due to the combination of a recession and stubbornly high inflation, but there is far greater demand for affordable units than supply. This bodes well for the continued stable performance of LIHTC properties, particularly since we believe that rental affordability will continue to be a challenge in 2023.
Ongoing Rent Growth Nationwide
We project that the multifamily sector will see a decline in demand during the first half of the year, resulting in negative rent growth for at least the first quarter of 2023. However, we also expect demand to increase during the second half of the year, which will likely result in a more normal rent growth resumption averaging about 1.5% for the full year of 2023. After two years of above-average rent increases, a decline in rent growth would be welcome news for many renters but is not expected to contribute much to increased affordability, at least not at a national level.
Wage Growth More Relevant for Rent
Wages measure earnings from work, while income can include non-work income such as interest and dividends. While growth in overall income will help with rental affordability, many renters rely solely on wages, making wage growth an important indicator of affordability.
Middle Market Affordability Continues to Erode
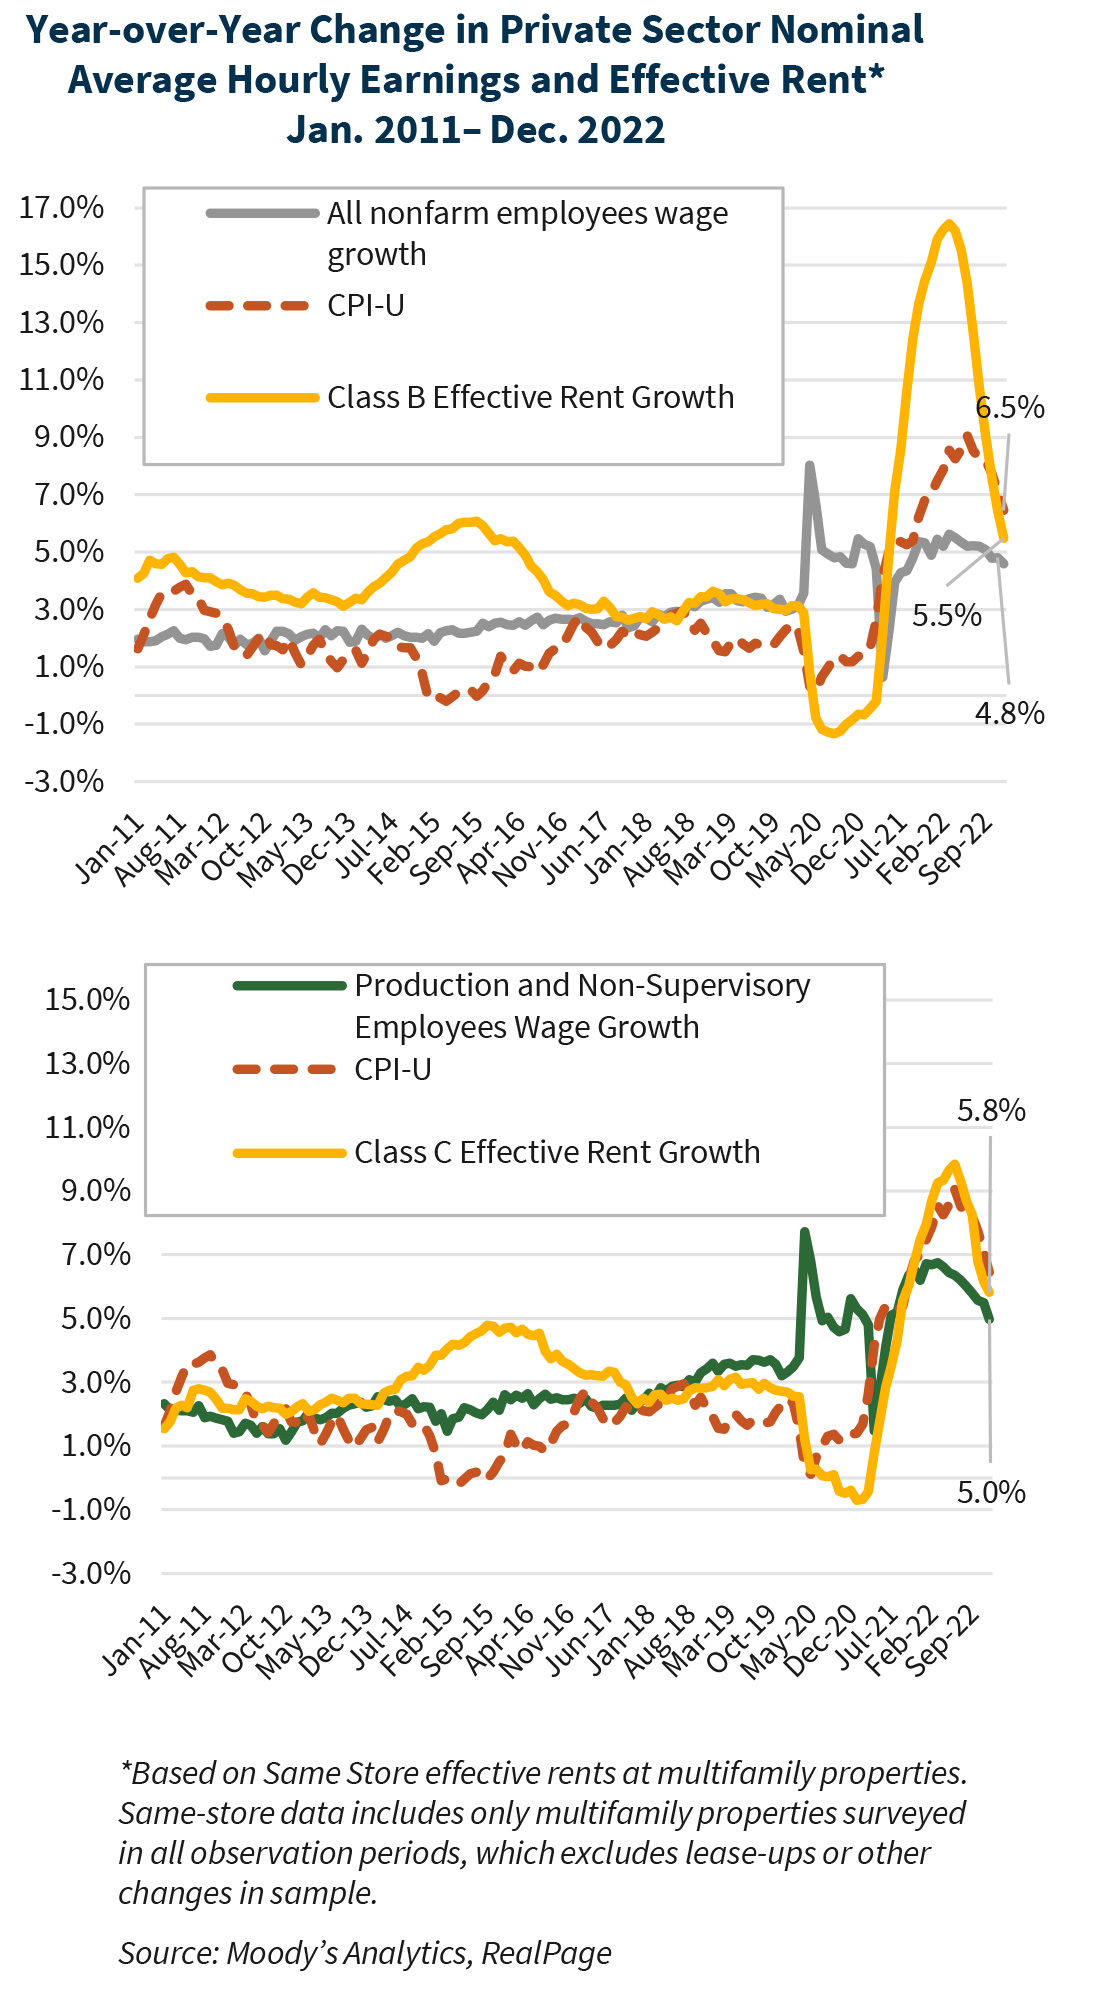
Improvement in rental affordability is primarily attained when wage growth meaningfully outpaces rent growth. Multifamily data provider RealPage, Inc., defines Class B rents as those rents that fall between the top 20% and bottom 20% of the rent distribution for a given metro (and are therefore in the mid-60% of the rent distribution). However, as shown in the top chart below, except for the 13-month period at the start of the pandemic-induced recession, year-over-year rent growth in the middle market Class B segment has outpaced or kept pace with wage growth almost every month since January 2011. The gap is narrowing. As of December 2022, year-over-year Class B rent growth was 5.5%, only 0.6 percentage points higher than the 4.8% wage growth recorded.
Class C Affordability Also Eroding
RealPage defines Class C rents as those in the bottom 20% of the rent distribution for a given metro, making them the most affordable rents. These are also the types of units that tend to be affordable for production and non-supervisory employees.
As shown in the lower chart above, the gap between the wages of production and non-supervisory employees and effective rent growth has been smaller for Class C units than for Class B units and, even prior to the pandemic, there were 20 months when wage growth slightly outpaced Class C effective rent growth. Even so, since January 2011, overall cumulative Class C effective rent growth has outpaced the wage growth of production and non-supervisory employees, despite some of the strongest wage gains in a decade. In 2022, Class C effective rent growth was 5.8%, still outpacing wage growth of 5.0% for production and non-supervisory employees, leading to a further erosion in affordability for the workers who can least afford it.
Vacancy Rates Expected to Rise Slightly...
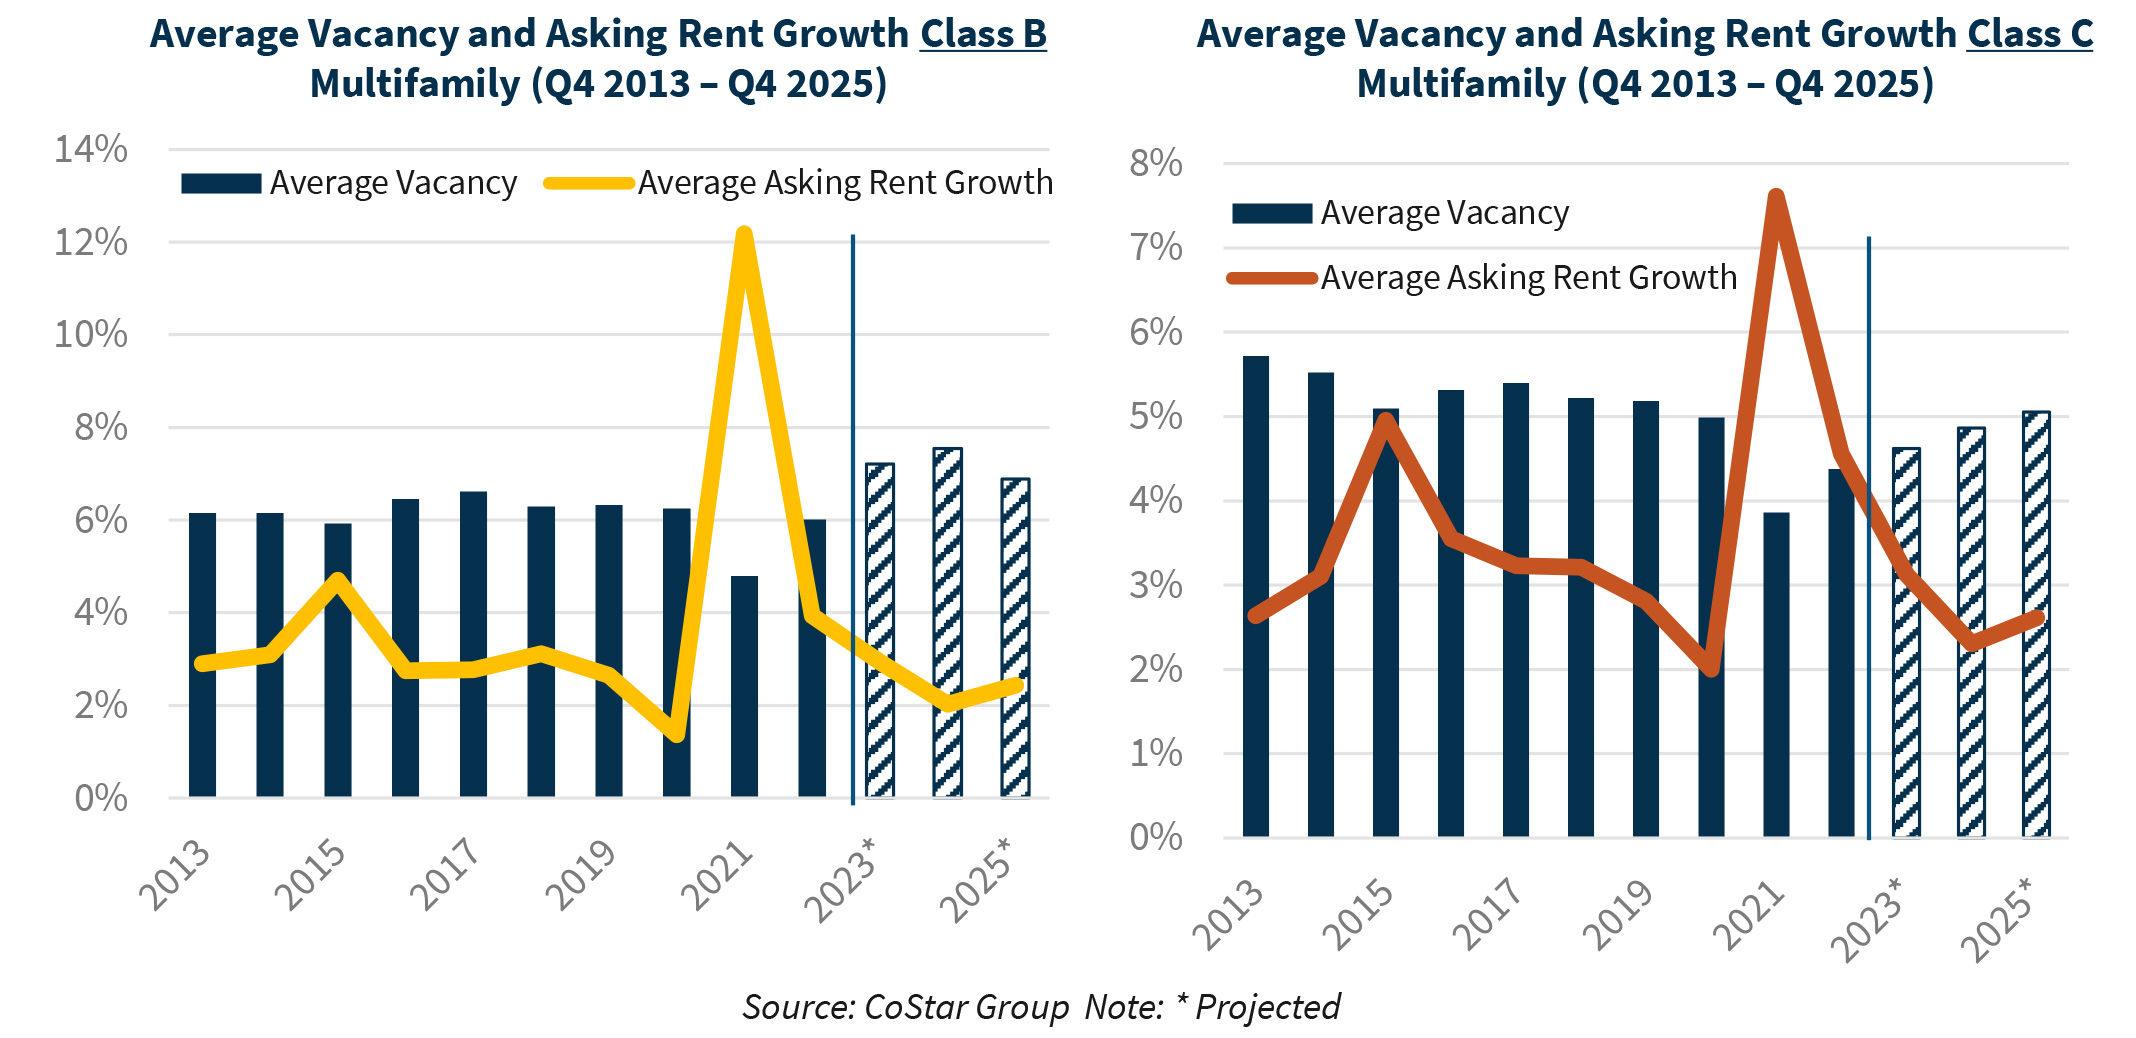
Based on our currently predicted moderate recession in the second quarter of 2023, combined with Class B properties having to adjust rents to compete with an above-average amount of Class A new supply being delivered in certain markets, both Class B and Class C fundamentals are projected to soften in 2023. As shown in the left chart below, CoStar projects that the average Class B vacancy rate is expected to rise to 7.2% in 2023, then 7.5% in 2024, which is slightly above the 6.1% average over the past 10 years. Similarly, as shown in the right chart below, the average Class C vacancy rate is expected to rise to 4.6% in 2023, then again in 2024 to 4.9%. Even so, it is expected to remain below the 5.1% average over the past 10 years leaving a tight market for the lowest income renters.
...and Rent Growth is Expected to Slow Slightly
In addition, CoStar projects that the average Class B asking rent will likely slow to 2.9% in 2023, followed by a 2.0% increase in 2024. Excluding the double-digit spike in 2021, the average rent increase for Class B apartments was 3.0% since 2013.
We believe that Class C rent growth will likely be slightly stronger at 3.1% in 2023 followed by a 2.0% increase in 2024. While the average asking rent is expected to grow more slowly than the 3.8% average over the past decade, nationwide, we do not expect Class C asking rents to fall.
New Supply Will Have Limited Impact
While Fannie Mae is expecting a recession in the second quarter of 2023, there are over 780,000 new multifamily units slated for completion by the end of 2023, consisting primarily of Class A units, which are the most expensive to rent. In addition, due to construction delays resulting from labor shortages and elevated materials prices, it is unlikely that all new units will be delivered as scheduled, making it unlikely that new supply will have a significant impact on affordability nationwide.
Even in metros such as Phoenix, Austin, and Dallas, where job growth is not expected to support the level of new supply provided, we believe Class B properties will likely have to drop their rents to compete with the new Class A coming online in only certain submarkets. As a result, we do not see a reversal in the long-term trend of declining affordability in 2023.
Tanya Zahalak
Multifamily Economics and Strategic Research – Economics – Advisor Economist
Multifamily Economics and Strategic Research
February 2023
Opinions, analyses, estimates, forecasts, and other views of Fannie Mae’s Economic and Strategic Research (ESR) Group included in these materials should not be construed as indicating Fannie Mae’s business prospects or expected results, are based on a number of assumptions, and are subject to change without notice. How this information affects Fannie Mae will depend on many factors. Although the ESR Group bases its opinions, analyses, estimates, forecasts, and other views on information it considers reliable, it does not guarantee that the information provided in these materials is accurate, current, or suitable for any particular purpose. Changes in the assumptions or the information underlying these views could produce materially different results. The analyses, opinions, estimates, forecasts, and other views published by the ESR Group represent the views of that group as of the date indicated and do not necessarily represent the views of Fannie Mae or its management.
© 2023 Fannie Mae